
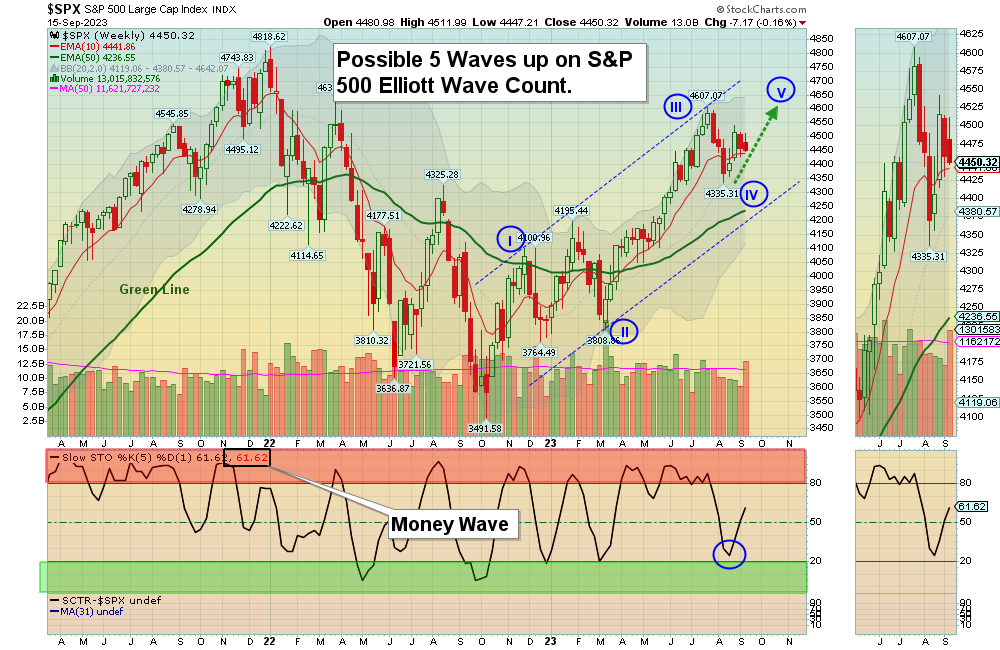
9/17/2023 Markets were mixed for the week as Treasury Bonds have not bounced up off the October Support yet. Stocks need Bonds to bounce up, and then the S&P 500, NASDAQ 100 and Tech Funds should continue up on Wave 5. Internally Stocks are weaker now, as only 34 % of the S&P 500 stocks are still above the 50-day averages. That is why it is harder to make money on an average stock lately. The CNN Fear & Greed Index is neutral at 52.
The low Bond prices has caused long term Interest & Mortgage Rates to surge up and create slow down Fears. But T-Bonds are over sold (Way Below the Green Line) on FEAR, and near Support. Last October when Bonds went down and bounced up from the Support, the S&P 500 rallied 15%.
If you continue to Follow the Green Line System, your Money should flow into the Strongest areas and your account value should be able to grow in both Bull and Bear Markets. Follow the MONEY, not the MEDIA.
_____________________________________________________________________________________________
For the week the Dow was up 0.16%, the S&P 500 was down 0,13% and the NASDAQ 100 was down 0.48%. Many of the major Indices still have a Relative Strength below 80, so you should currently own the stronger Funds here.
The Inflation Index (CRB) was up 1.80% for the week and is Above the Green Line, indicating Economic Expansion.
Bonds were down 1.49% for the week, and are Below the Green Line, indicating Economic Expansion.
The US DOLLAR was down 0.08% for the week and is Above the Green Line.
Crude Oil was up 2.87% for the week at $90.02 and GOLD was up 0.18% at $1946.20.
_____________________________________________________________________________________
We are doing many micro Day Trades on our new Discord site (free). Please join Discord on your cell phone app for day trading mobile notifications during the day. Other methods of notification have been too slow. Also, please check our our Live Streaming on YouTube during Market hours.
More action this week on the Day Trading Scrolling Charts, and Day Trading Charts for Indices & Large Caps.
_____________________________________________________________________________________________
MONEY BUYS SOON:
We are in now in 7 logged Swing Trading Positions for the Short & Medium Term. There are 6 investments on the Short Term Watch List.
Be patient and WAIT for Green Zone Buy Signals!
LONG TERM INVESTMENTS:
Long Term Scrolling Charts (Real Time)
AI C3 AI INC. Buy above $33.67 with High Volume with a 3% Trailing Sell Stop Loss below it.
EXAS EXACT SCIENCES CORP. Wait for next Weekly Money Wave Close > 20 with High Volume.
GBTC GRAYSTONE BITCOIN FUND Buy above $21.10 with High Volume with a 3% Trailing Sell Stop Loss below it.
PINS PINTEREST INC. Buy above $30.86 with High Volume with a 3% Trailing Sell Stop Loss below it.
RIOT RIOT PLATFORMS INC. Wait for next Weekly Money Wave Close > 20 with High Volume.
SH INVERSE S&P 500 FUND Buy above $17.71 with High Volume with a 3% Trailing Sell Stop Loss below it.
STNE STONECO LTD. Buy above $14.83 with High Volume with a 3% Trailing Sell Stop Loss below it.
TAL TAL EDUCATION GROUP Buy above $10.45 with High Volume with a 3% Trailing Sell Stop Loss below it.
WW WEIGHT WATCHERS INT’l. Buy above $12.13 with High Volume with a 3% Trailing Sell Stop Loss below it.
__________________________________________________________________________________________
My Trading Dashboard
Swing Trading Scrolling Charts
Day Trading Scrolling Charts
Click for Watch Lists
Click for Current Positions
Click for Closed Positions
Updated Top 100 List Sep 1, 2023
Dividend Growth Portfolio
Updated ETF Sector Rotation System
Dogs of the DOW System
Long Term Strategy for IRAs & 401k Plans
CNN Fear & Greed Index
Scrolling Stage Chart Investing Charts
Alert! Market Risk is Medium (YELLOW). The probability of successful Short Term Trades is better, when the % of stocks above the 50-day avg. is below 20.
Tell your Friends about the Green Line, and Help Animals.
________________________________________________________________________________
QUESTION: Jerry S. writes “How do I know when to Sell?”
ANSWER: Hi Jerry. Please follow the Rules for Selling below based on the Time Frame that you want to be in the Investment:
- Short Term: Sell when it Closes below the Pink Line (10-day avg.)
- Medium Term: Sell when it Closes below the Red Line (50-day avg.)
- Long Term: Sell when it Closes below the Green Line (250-day avg).
Or Follow the Current Positions (please click) on your daily emails.
Good trading, and tell your friends!
Related Post
– AI


