
Markets were mostly lower for the week as long term Interest Rates stretched Way Above the Green Line. Eventually Interest Rates will return near the Green Line (like they always do), when the Economy slows down more.
Stocks & Bonds are Way Below the Green Lines on FEAR. Commodity prices are falling as if the FED has probably OVER-TIGHTENED. The Fear will eventually subside and these Investments will eventually return near their Green Lines.
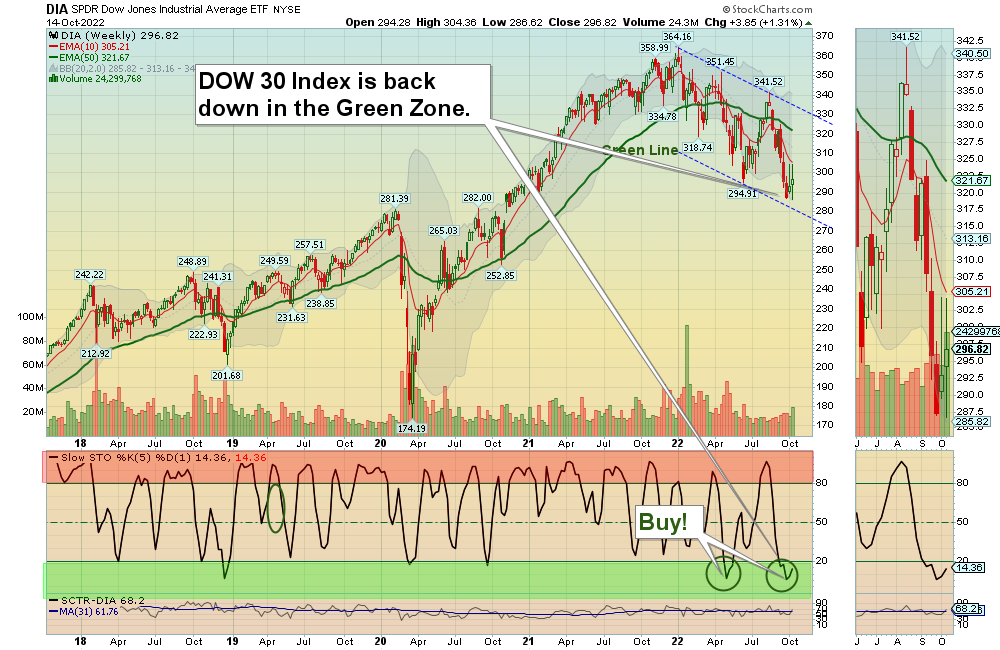
The last time the Markets were this over-sold was in June and then the Markets bounced up 19%. Get ready for an over-sold bounce soon.
If you continue to Follow the Green Line System, your Money should flow into the Strongest areas and your account value should be able to grow in both Bull and Bear Markets.
________________________________________________________________________________________________________________________________________________
For the week the Dow was up 1.31%, the S&P 500 was down 1.42%, and the NASDAQ 100 down 3.11%. Currently the major Stock Indices are Below the Green Lines and have low Relative Strength (own stronger Securities here).
The Inflation Index (CRB) was down 3.12% for the week and is Above the Green Line, indicating Economic Expansion.
Bonds were down 2.40 % for the week, and are Below the Green Line, indicating Economic Expansion.
The US DOLLAR was up 0.46% for the week and is Way Above the Green Line.
Crude Oil was down 7.59% for the week at $85.61 and GOLD was down 3.53% at $1648.90.
More action this week on the Day Trading Scrolling Charts.
DAY TRADING CHARTS FOR INDICES & LARGE CAPS.
We have not had many intra-day Trade Alert signals lately as the Volume has been too Low with the Buy Signals. These low Volume Buy Signals tend to pop up and quickly fade back down. We like to see High Volume on rallies.
_____________________________________________________________________________________________
MONEY WAVE BUYS SOON:
We are in now in 10 logged Current Positions for the Short & Medium Term. There are 6 investments on the Short Term Watch List.
Be patient and WAIT for Green Zone Buy Signals!
LONG TERM INVESTMENTS: (Hard to find many Long Term now because most normal Investments no longer have 80 Relative Strength required.)
Long Term Scrolling Charts (Real Time)
AR ANTERO RESOURCES Weekly Money Wave Closed > 20 but Volume was not high. AVOID.
CTIC CTI BIOPHARMA Wait for Weekly Money Wave Close > 20 with High Volume.
DLTR DOLLAR TREE INC. Buy if it Closes above $146.17 with High Volume.
ENPH ENPHASE ENERGY Wait for Weekly Money Wave Close > 20 with High Volume.
SIGA SIGA TECH. Wait for Weekly Money Wave Close > 20 with High Volume.
SQM SOCIEDAD QUIMICA (Chemicals) Wait for Weekly Money Wave Close > 20 with High Volume.
VIPS VIPSHOP HOLDINGS Buy if it Closes above $13.32 with High Volume. (now in nice Stage 1 Base).
______________________________________________________________________________________________________
My Trading Dashboard
Swing Trading Scrolling Charts
Day Trading Scrolling Charts
Click for Watch Lists
Click for Current Positions
Click for Closed Positions
Updated Top 100 List Oct 1, 2022
Dividend Growth Portfolio
Updated ETF Sector Rotation System
Dogs of the DOW System
Long Term Strategy for IRAs & 401k Plans
CNN Fear & Greed Index
Scrolling Stage Chart Investing Charts
Alert! Market Risk is Low (GREEN). The probability of successful Short Term Trades is better, when the % of stocks above the 50-day avg. is below 20.
Tell your Friends about the Green Line, and Help Animals.
________________________________________________________________________________
QUESTION: Winter writes ““Don’t take a Loss” confuses me. What does that mean?”
ANSWER: When the Investment has a Money Wave Buy Signal, it should pop up 3-6 % in just a few days.
If it is not popping up well, and the Money Wave > 50, either Get Out even, or Don’t Take a Loss!
Something must be Wrong. There will be plenty more… Raise Cash, and don’t get Stuck! Wait for the next one.
Good trading and tell your friends!
ATGL


