
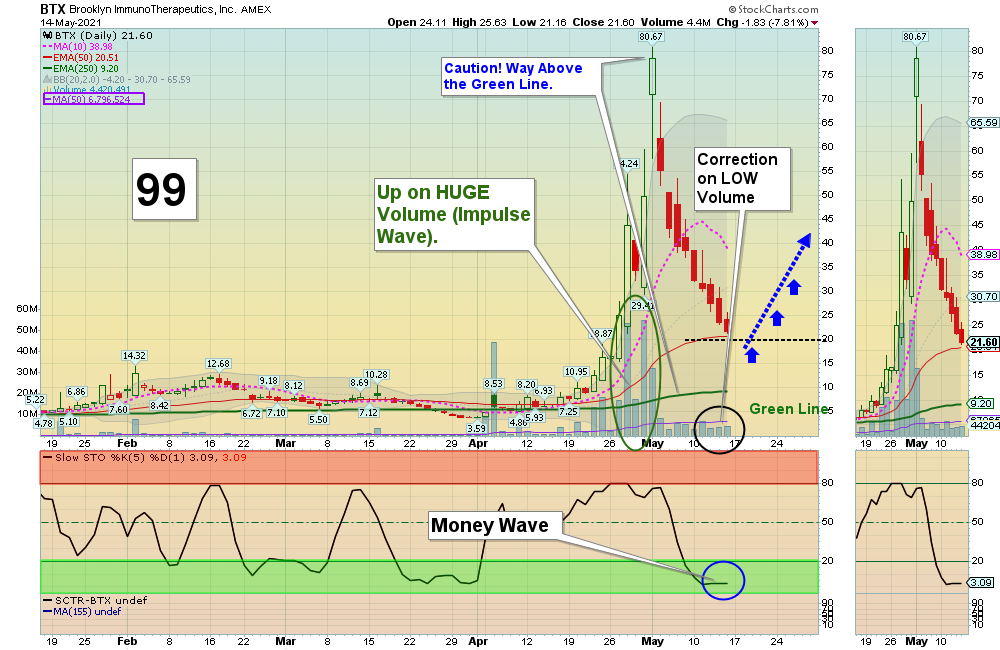
The Chart above shows the typical “Buy the Dip” System that we use at the Green Line. First the Investment surges up to New Highs on huge Volume and High Relative Strength (then Smart Money takes profits). Second the Investment fades back down on Low Volume until it becomes over-sold (and Smart Money dips back in). Usually if the Volume and Relative Strength are very High on the way up, then the Investment will have another big pop after the pull-back. But WHEN you Buy is critical.
5/9/2021 Markets were lower for the week as the Indices did not like the Inflation report of 4.2% for the last 12 months. This is way above the FED’s goal of 2 %. It’s very possible that the FED will slow down their massive Printing before the end of this year, and break their promise.
The S&P 500 and DOW 30 Indices dipped down to the Red Line (50-day avgs.) early this week and then bounced back up. Now they need to make Higher Highs for the rally to continue. The NASDAQ 100 and Small Cap Indices were not able to get back above the Red Lines, which indicates weakness.. The Markets are very extended (+85 % in the last year) and the Relative Strength on the major Indices is dropping.
There are several Long Term Investments below that have already corrected 30 % (down near the Green Lines) and should pop back up again. It has become harder to make much Money lately on Swing Trading.
SEE COMMODITY CHARTS Look how strong they are.
For the week the Dow was down 1.04%, the S&P 500 was down 1.31%, and the Nasdaq 100 was down 2.34%. The Long Term Trend for the Indices is up.
The Inflation Index (CRB) was down 1.77% for the week (a New High) and is Above the Green Line, indicating Economic Expansion.
Bonds were down 1.54% for the week, and are Below the Green Line, indicating Economic Expansion.
The US DOLLAR was up 0.11% for the week.
Crude Oil was up 0.72% for the week at $65.37 and GOLD was up 0.37% at $1838.10.
_____________________________________________________________________________________________
MONEY WAVE BUYS SOON
We are currently in 3 logged Current Positions, for the Short & Medium Term. There are 7 Investments on the Short Term Watch List.
Be patient and WAIT for Green Zone Buy Signals!
______________________________________________________________________________________________
LONG TERM INVESTMENTS (Several Leaders have pulled back, but Markets are on Highs.)
DBC COMMODITY FUND Buy on the next Daily Money Wave Buy Signal with High Volume.
ETSY ETSY INC. Buy if it Closes above $170.98 with High Volume.
FCEL FUELCELL ENERGY INC. Buy if it Closes above the Red Line (50-day avg.) with High Volume.
ICLN GLOBAL CLEAN ENERGY FUND Buy if it Closes the Red Line with High Volume.
LAC LITHIUM AMERICAS FUND Buy if it Closes above the Red Line (50-day avg.) with High Volume.
PENN PENN NATIONAL GAMING Buy if it Closes above the Red Line (50-day avg.) with High Volume.
PLUG PLUG POWER INC. Buy if it Closes $30.34 with High Volume.
RIOT RIOT BLOCKCHAIN Buy on the next Daily Money Wave Buy Signal with High Volume.
TAN SOLAR FUND Buy if it Closes above the Red Line on High Volume.
TRIP TRIPADVISOR INC. Buy if it Closes above $47.81 with High Volume.
XBI BIOTECH FUND Buy if it Closes above the Red Line (50-day avg.) with High Volume. (Relative Strength is below 80).
______________________________________________________________________________________
Click for Watch Lists
Click for Current Positions
Click for Closed Positions
New: My Trading Dashboard
Day Trading Watch List
NEW Top 100 List May 1, 2021
Dividend Growth Portfolio
ETF Sector Rotation System
Dogs of the DOW System
Long Term Strategy for IRAs & 401k Plans
CNN Fear & Greed Index
Scrolling Stage Chart Investing Charts
Alert! Market Risk is HIGH (Red Zone). The probability of successful Short Term Trades is better, when the % of stocks above the 50-day avg. is below 20.
Tell your Friends about the Green Line, and Help Animals.
___________________________________________________________________________________________


