
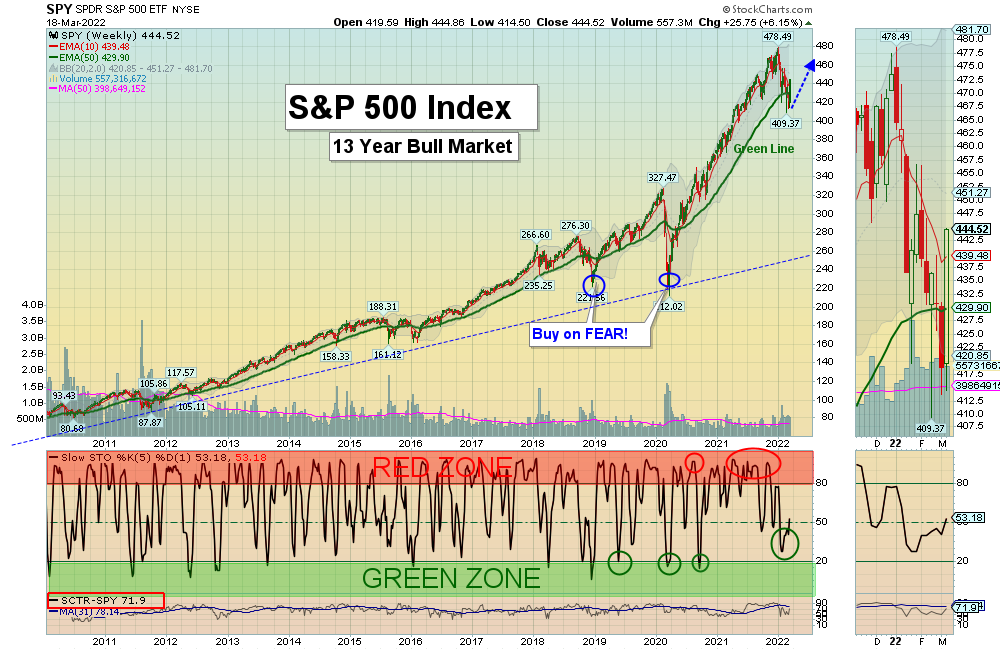
The S&P 500 Index should re-test the High again.
3/20/2022 Markets were sharply higher for the week, as the Indices were very over-sold from FEAR. The Indices have now successfully re-tested the February Lows and good Buying came in after the Selling dried up. Recently a majority most of the investment newsletter writers (Sentiment Indicator) thought the Markets were in a down or Bear Market. So history tells us to do the opposite when most agree, and Buy.
Short Sellers who benefit from declining Markets took profits and bought back their positions to cover. We don’t normally Short until the Markets are in down trends (why sail INTO the wind?)
Now the Strongest Funds (Click) and those that were able to hold Above the Green Lines must make New Highs again for the Markets to remain Bullish. This year has been difficult so far for most to make much money. It is not a good sign that Amazon, Facebook and NetFlix are all Below the Green Lines today. Eventually the Markets will turn down, but we should have plenty of other areas to rotate your Money into that still meet the Green Line Rules (like Inverse Funds). There should always be investments for Smart Money to rotate into. Are YOU Smart Money, or will you struggle to change and get stuck in inferior investments that are Below the Green Lines?
If you continue to Follow the Green Line System, your Money should flow into the Strongest areas and your account value should be able to grow in both Bull and Bear Markets.
There has been plenty of action on the Day Trading Scrolling Charts.
DAY TRADING CHARTS FOR INDICES & LARGE CAPS.
We have not had many intra-day Trade Alerts lately as the Volume has been too Low on Buy Signals. We like to see High Volume on rallies.
For the week the Dow was up 5.44%, the S&P 500 was up 6.15%, and the NASDAQ 100 was up 8.35%. The Long Term Trend for the Indices is up.
The Inflation Index (CRB) was down 0.97% for the week and is Above the Green Line, indicating Economic Expansion.
Bonds were down 1.09% for the week, and are Below the Green Line, indicating Economic Expansion.
The US DOLLAR was down 0.91% for the week and is Above the Green Line.
Crude Oil was down 5.71% for the week at $103.09 and GOLD was down 2.81% at $1929.30.
_____________________________________________________________________________________________
MONEY WAVE BUYS SOON
We are in 5 logged Current Positions for the Short & Medium Term, and we have CASH to Buy soon. There are investments on the Short Term Watch List.
Be patient and WAIT for Green Zone Buy Signals!
_________________________________________________________________________________________
LONG TERM INVESTMENTS (many Large Caps no longer have 80 Relative Strength required.)
Long Term Scrolling Charts (Real Time)
AMD ADVANCED MICRO Buy if it Closes above the Red Line of $118 with High Volume.
F FORD MOTOR CO. Buy if it Closes above the Red Line of $18.07 with High Volume.
NVDA NVIDIA CORP. Shot up 20 % this week and Closed above the Red Line (or Buy on the next Daily Money Wave Buy Signal).
XLK TECH FUND Closed at the Red Line but the Volume was not High. Wait for the next Daily Money Wave Buy Signal.
XLRE REAL ESTATE FUND Closed above $46.88 but the Volume was not High. Wait for the next Daily Money Wave Buy Signal.
________________________________________________________________________________
My Trading Dashboard
Swing Trading Scrolling Charts
Day Trading Scrolling Charts
Click for Watch Lists
Click for Current Positions
Click for Closed Positions
Updated Top 100 List Mar 1, 2022
Dividend Growth Portfolio
ETF Sector Rotation System
Dogs of the DOW System
Long Term Strategy for IRAs & 401k Plans
CNN Fear & Greed Index
Scrolling Stage Chart Investing Charts
Alert! Market Risk is MEDIUM (Yellow). The probability of successful Short Term Trades is better, when the % of stocks above the 50-day avg. is below 20.
Tell your Friends about the Green Line, and Help Animals.
________________________________________________________________________________
Albert writes ” I signed up for Trade Alerts by Twitter but NEVER get a notification from you.”
Then BUY immediately! EXIT if the Stock falls below the Pink Dotted Line (10-hour average).Keep refreshing the page for updated “Real Time” Charts. Works best when the Volume is High.
Thanks for writing!
ATGL


