Above the Green Line -01
  • Market Insights
        • Commentary
          • Daily
          • Weekly
        • BUY / SELL SIGNALS
          • Trade Posts
          • Recent Trade Alerts
          • Recent Day Trades
        • BLOGROLL
          • Dividend Growth Blog
          • ETF Sector Blog
          • Dow Dogs
          • TPOW Blog
  • Strategies
        • SWING TRADING
          • Current Positions
          • Watchlists
          • Closed Positions
          • Candidates - TOP 100
          • Specialty Stocks
        • WEEKLY STOCK PICK
          • TPOW Charts
          • TPOW Performance
          • TPOW Strategy Guide
          • TPOW Performance Dashboard
        • DAY TRADING
          • Watch List
        • ATGL DASHBOARD
        • ETF STRATEGIES
          • ETF Sector Rotation
          • ETF Sector Portfolio
        • DIVIDEND GROWTH
          • Dividend Growth Portfolio
          • Dividend Calendar
        • DOGS OF THE DOW
          • Dogs of the Dow Portfolio
          • DOW 5 Portfolio
  • Markets
        • US MARKET
          • Commodities
          • Energy
          • Precious Metals
          • Volatility
        • GLOBAL MARKETS
          • Market Indices
          • Economic Calendar
          • FOREX Heat Map
          • FOREX Cross Rates
          • Crypto Currency Market
  • Investing
    • Discord Community
    • Dashboard
  • Resources
        • ARTICLES
          • Dividend Growth Model Articles
          • ETF Articles
          • Investment Strategies Articles
          • Market and Economic Insights
          • Stock Trade Articles
          • Stock Reviews
        • TOOLS
          • Stock Scanners
          • Charting Software
          • Brokerage Firms
        • STOCK CHARTS
          • Key Components
          • Reading Charts
          • Drawing Stock Charts
          • Identifying Trends
        • RETIREMENT PLANNING
  • About
    • Contact Us
    • How to Win
    • #1 At Stockcharts
    • Disclaimer
    • FAQ
  • Log In
  • Subscribe

June 30, 2019

Green Line Weekly Jun 30, 2019

SPX Chart
S&P 500 Index has bounced nicely off the Green Line.


06/30/2019:  Markets were mixed for the week, after the Indices bounced up off the Pink Lines (10-day avgs.) to avoid Short Term Sell Signals. Maybe some good China Trade news on Monday to push the Markets higher.

Many are waiting for more FED Printing to stimulate the Economy. The Fed Futures are pointing to an 80% chance of a July Rate cut. 

Bonds are Way Above the Green Line, and new signs of Economic strength should cause Bonds to drop.

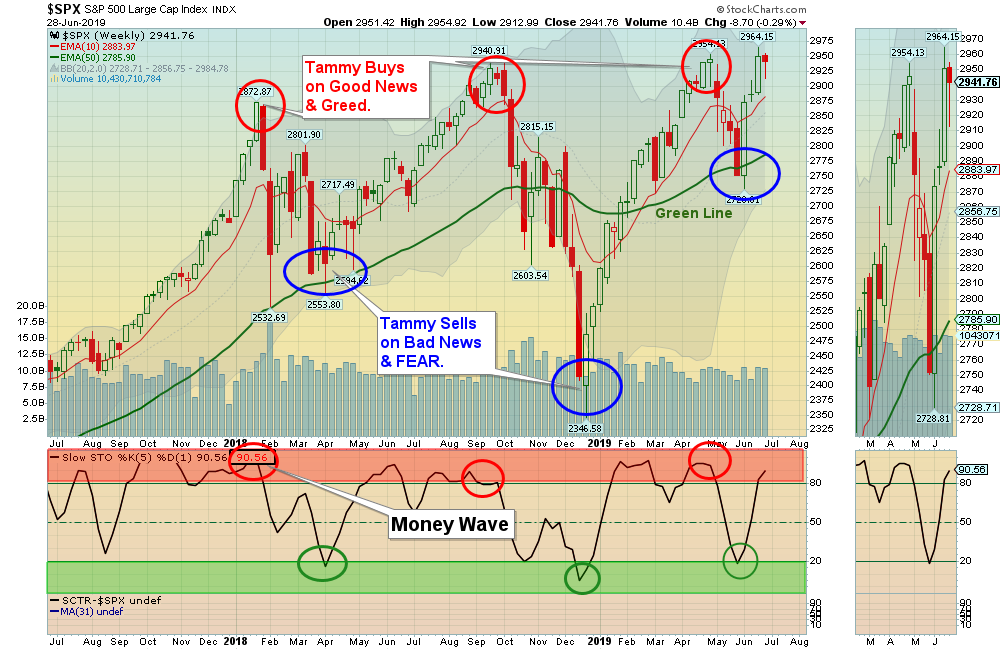
For the week the Dow was down 0.45%, the S&P 500 was down 0.29%, and the Nasdaq 100 was down 0.75%.  The very Long Term Trend on the Stock Markets is UP.  

The Inflation Index (CRB) was up 1.41% and is Below the Green Line, indicating Economic Weakness.

Bonds were up 1.05% for the week and are Way Above the Green Line, indicating Economic Weakness.

The US DOLLAR was up 0.08% and Closed below the 50-day avg. Could be a huge Double Top from 3 years ago. 

Crude Oil was up 1.81% for the week at $58.47, and GOLD was up 0.97%  at $1413.70.

___________________________________________________________________________________________

COMPLETED TRADES THIS YEAR (Jan 1- Jun 30 2019)

66 Completed Trades

45 Wins

21 Losses

Average per Trade was 3.27%… Total for 66 Trades was 215.55 %.


MONEY WAVE BUYS SOON:   

We are currently in 8 logged Open Positions, for the Short & Medium Term.  There are 5 Investments on the Short Term Watch List. 

Be patient and WAIT for Green Zone Buy Signals!

______________________________________________________________________________________________

LONG TERM INVESTMENTS 

Buy the Leading Investments that are down near the weekly Green Zones.   

HZNP     HORIZON PHARM.      Wait for Weekly Close Above the Red Line of $24.63.

IONS     IONIS PHARM.      Wait for Weekly Close Above the Red Line of $67.01.

LLY    ELI LILLY & CO.    Wait for Weekly Close Above the Red Line of  $116.06.   

RAMP     LIVE RAMP HOLDINGS      Wait for Weekly Close Above the Red Line of $52.37.

VMW    VMWARE INC.    Wait for Weekly Close Above the Red Line of $180.25.  

___________________________________________________________________________________________

Click for  Portfolio (Open Positions)  
Click for  Watch List
Click for  Closed Positions


Alert! Market Risk is MEDIUM (Yellow Zone). The probability of successful Short Term Trades is better, when the % of stocks above the 50-day avg. is below 20. 

Tell your Friends about the Green Line, and Help Animals

___________________________________________________________________________________________

QUESTION:  Mark writes “Hello, new subscriber here. Your system looks great, I love the lack of complexity.

Wondering if you ever are okay with people buying the day or two before a complete signal, if it’s looking very likely the signal will be met?  I see that it looks like when the signal is greenlighted it’s often perhaps too late to get in.  Thank you.”  

ANSWER:   Yes, sometimes the Strongest Investments never Close in the Green Zone, and bounce back up again.  It is OK for you to Buy early and break the Rules, but only if you put in a real Sell Stop Loss below your Buy Price. Many subscribers use the 60-min Chart Signals (see Triple Buy Signal on FAQ Page) to jump the gun.

Good trading, and tell your friends!

Related Post

– Green Line Weekly Jun 23, 2019

Subscribe to Our Newsletter

AGL Logo

Get our eBook Now!

Candlestick - A Swing Traders Friend

We don’t spam! Read our privacy policy for more info.

You’ve been successfully subscribed to our newsletter!

Voted #1 at Stock Charts

SH Chart
Inverse S&P 500 Fund (SH) will have a Money Wave Buy today.

Help Us Help Animals

Help Us Help Animals

Recent Comments

  • Market Breadth Indicators: A Trader’s Guide to Early Trend Detection on Backtesting: Definition and How a Trading Strategy Backtest Works
  • Island Reversal Pattern: Definition and Formation Explained on Double Top Pattern: How to Identify and Trade This Reversal Signal
  • Channel Pattern Guide: What It Is and Why It Matters on A Guide to Forecasting Using Moving Averages
  • What Is a Broadening Bottom Chart Pattern? Full Guide on Bull vs. Bear Market: An Investor’s Guide to Market Phases
  • ATGL Weekly Money Flow - 2025-05-11 on ATGL Top Pick of the Week! Apr 6, 2025

Become a Green Liner!

Help me make more Money in the Stock Market.

ON ATGL

  • DashBoard
  • Weekly Commentary
  • Daily Buy / Sell Signals
  • Day Trade Setup
  • Trading Rooms

Design & Develop By Pixelvect

STRATEGIES

  • Swing Trading
  • ATGL Pick of the Week
  • Dividend Growth
  • ETF Sector Rotation
  • Dogs of the Dow

HELP

  • ATGL Trading Rules
  • FAQ
  • Account Maintenance
  • Contact US
  • Join

FOLLOW US

Instagram Linkedin Twitter Facebook

© COPYRIGHT 2024 · ABOVETHEGREENLINE.COM · ALL RIGHTS RESERVED · PRIVACY · TERMS · CONTACT · WATCHLIST · CURRENT