
06/23/2019: Markets were up for the week, after hopeful news of more FED Printing to stimulate the Economy. The Fed Futures are pointing to an 80% chance of a July Rate cut.
The News is basically GOOD again, after the Markets bounced up 8 % from last month’s Bad News Low. We like to Buy on Bad News. Please be patient and WAIT for the Indices and Leaders to return to their Green Zones for more Money Wave Buys..
For the week the Dow was up 2.41%, the S&P 500 was up 2.20%, and the Nasdaq 100 was up 3.25%. The very Long Term Trend on the Stock Markets is UP.
The Inflation Index (CRB) was up 2.12% and is Below the Green Line, indicating Economic Weakness.
Bonds were down 0.02% for the week and are Way Above the Green Line, indicating Economic Weakness.
The US DOLLAR was down 1.37% and Closed below the 50-day avg. Could be a huge Double Top. from 3 years ago.
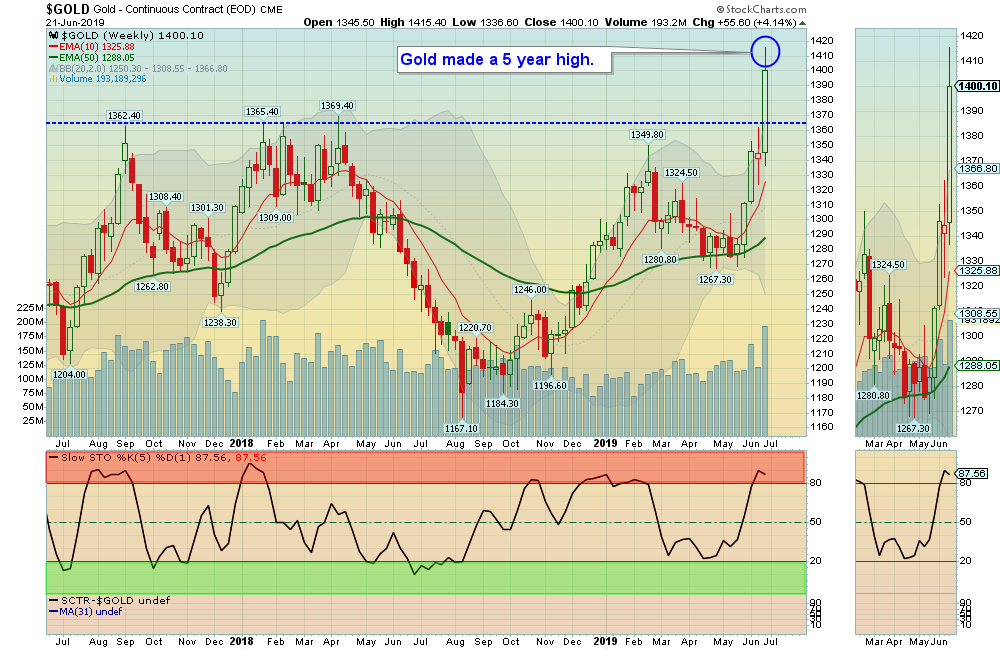
Crude Oil was up 9.37% for the week at $57.43, and GOLD was up 4.14% at $1400.10.
___________________________________________________________________________________________
COMPLETED TRADES THIS WEEK:
2019-06-04 XLU Utilities Fund $58.88 2019-06-20 $61.24 $2.36 4.01%
2019-05-29 MTCH Match Group $69.32 2019-06-19 $70.34 $1.02 1.47%
2019-05-22 FB FaceBook Inc $185.32 2019-06-18 $188.47 $3.15 1.70%
2019-03-29 PBR PetroBras $15.92 2019-06-18 $15.79 -$0.13 -0.82%
2019-05-20 ZIXI ZIX Corp. $9.21 2019-06-17 $9.61 $0.40 4.34%
MONEY WAVE BUYS SOON:
We are currently in 4 logged Open Positions, for the Short & Medium Term. There are 3 Investments on the Short Term Watch List.
Be patient and WAIT for Green Zone Buy Signals!
______________________________________________________________________________________________
LONG TERM INVESTMENTS
Buy the Leading Investments that are down near the weekly Green Zones.
LLY ELI LILLY & CO. Buy when it is going to Close above the Red Line of $116.78.
UAA UNDER ARMOUR Wait for a re-test of $24.96 Support.
VMW VMWARE INC. Buy when it is going to Close above the Red Line of $182.22.
XLNX XILINX INC. Wait for the next Daily Money Wave Buy Signal.
___________________________________________________________________________________________
Click for Portfolio (Open Positions)
Click for Watch List
Click for Closed Positions
Alert! Market Risk is MEDIUM (Yellow Zone). The probability of successful Short Term Trades is better, when the % of stocks above the 50-day avg. is below 20.
Tell your Friends about the Green Line, and Help Animals
___________________________________________________________________________________________
QUESTION: Stan writes ” Do you ever Sell Investments Short?”
ANSWER: Hi Stan, as long at the major Indices are in up-trends we will not Short, as most Followers don’t understand Selling Short. We will use Inverse Funds when they meet the Green Line Rules.


