
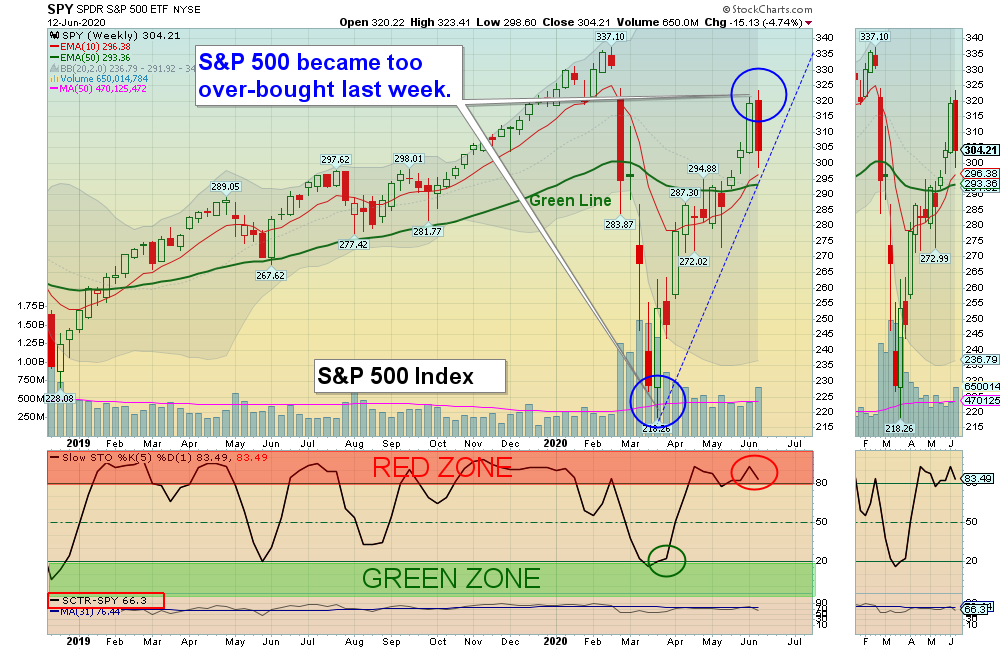
06/14/2020 Markets were down for the week as the Indices were over-bought and up in the Red Zones (probably too late to Buy for the Short Term). Now the Indices are returning down near the Red Lines (50-day avgs.) and should bounce up from there and re-test the June Highs.
The Nasdaq 100 Index is the strongest Index and was able to exceed the Feb Highs on Wednesday (with the help of the FAAMNG Stocks). The “Easy Money” from the March Lows might be ending as the Massive FED Printing Chart shows that the Money Supply growth dropped this week, as the FED cannot Print forever.
Please WAIT as the Strongest Leaders are now returning back down to their Green Zones for Money Wave Buy Signals soon.
For the week the Dow was down 5.45%, the S&P 500 was down 4.74%, and the Nasdaq 100 was down 1.59%. The Long Term Trend for the Indices is up.
The Inflation Index (CRB) was down 3.35% and is Below the Green Line, indicating Economic Weakness.
Bonds were up 3.97% for the week and are Above the Green Line, indicating Economic Weakness.
The US DOLLAR was up 0.19 % for the week but Closed below the Green Line.
Crude Oil was down 8.32% for the week at $36.26 and GOLD was up 3.23% at $1737.30.
_____________________________________________________________________________________________
MONEY WAVE BUYS SOON:
We are currently in 2 logged Open Positions, for the Short & Medium Term. There are 6 Investments on the Short Term Watch List.
Be patient and WAIT for Green Zone Buy Signals!
______________________________________________________________________________________________
LONG TERM INVESTMENTS (Most of the Leaders are back up in the Weekly Red Zones.)
Buy the Leading Investments that are down near the Weekly Green Zones.
AUY YAMANA GOLD Wait for next Daily Green Zone Buy Signal. All time High is $18.50.
DVAX DYNAVAX TECH Wait for next Daily Green Zone Buy Signal. All time High is $95.00.
KPTI KARYOPHARM THERA. Wait for next Daily Green Zone Buy Signal. All time High is $49.00.
LLNW LIMELIGHT NETWORKS INC. Buy if it Closes above $5.62 on High Volume. All time High s $53.40.
RRC RANGE RESOURCES CORP. Wait for next Daily Green Zone Buy Signal. All time High is $92.45.
______________________________________________________________________________________
Click for Portfolio (Open Positions)
Click for Watch List
Click for Closed Positions
Dividend Growth Portfolio (we are now posting a Dividend Calendar for the entire portfolio to assist with planning purposes).
ETF Sector Rotation System – Next Quarterly Rotation will be on June 30, 2020.
Long Term Strategy for IRAs & 401k Plans:
Alert! Market Risk is HIGH (Red Zone). The probability of successful Short Term Trades is better, when the % of stocks above the 50-day avg. is below 20.
Tell your Friends about the Green Line, and Help Animals
___________________________________________________________________________________________
QUESTION: Jerry S. writes “How do I know when to Sell?”
ANSWER: Hi Jerry. Please follow the Rules for Selling below based on the Time Frame that you want to be in the Investment:
- Short Term: Sell when it Closes below the Pink Line (10-day avg.)
- Medium Term: Sell when it Closes below the Red Line (50-day avg.)
- Long Term: Sell when it Closes below the Green Line (250-day avg).
Or Follow the PORTFOLIO (please click) on your daily emails.
Good trading, and tell your friends!


