
Watch List and Charts to Buy Soon.
| Daily Swing Watch List to Buy | Daily Swing Charts to Buy |
| Current Daily Swing Positions | Current Swing Charts |
| Closed Daily Swing Results | Trading Dashboard |
1/7/2024 Markets were lower for the week on normal profit taking. Now the Leaders and Indices have pulled back down to the daily Green Zones for Swing Trade Buys Signals back up soon.
Recently there were not many Swing Trade setups to Buy, as most of the strong Stocks had not corrected much. So we raised CASH, and soon we will Buy the Securities that made higher highs with High Volume on this pull back. Then normally a quick retest of highs.
If you continue to Follow the Green Line System, your Money should flow into the Strongest areas and your account value should be able to grow in both Bull and Bear Markets. Follow the MONEY, not the MEDIA.
______________________________________________________________________________
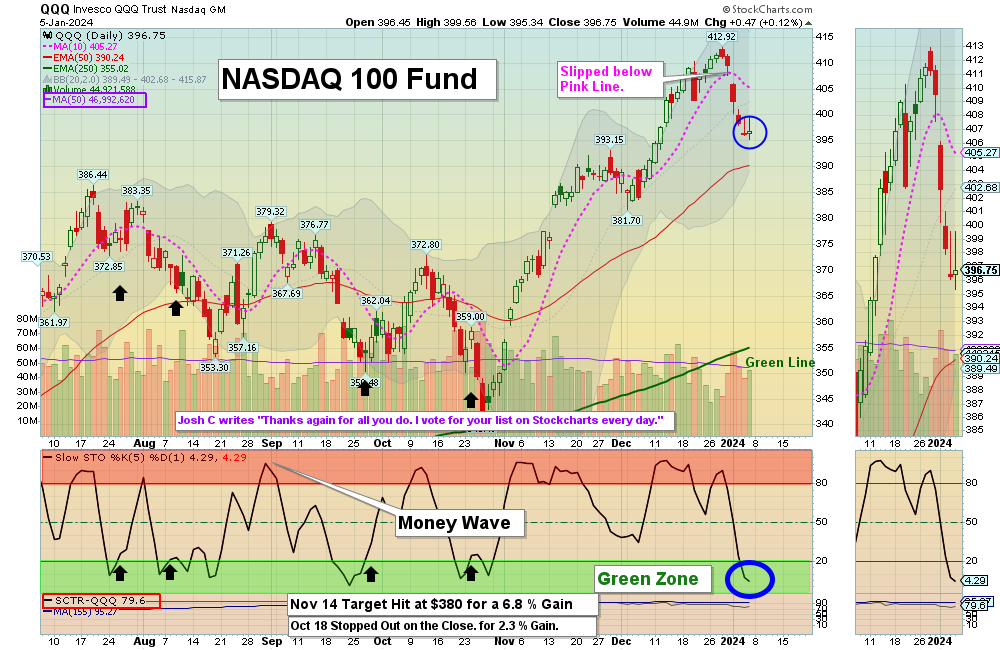
For the week the Dow was down 0.59%, the S&P 500 was down 1.55% and the NASDAQ 100 was down 3.12%. Many of the major Indices still have a Relative Strength below 80, so you should currently own the stronger Funds here.
The Inflation Index (CRB) was up 0.79% for the week and is Below the Green Line, indicating Economic Contraction.
Bonds were down 2.62% for the week, and are Below the Green Line, indicating Economic Expansion.
The US DOLLAR was up 1.09% for the week and is Below the Green Line.
Crude Oil was up 3.01% for the week at $73.81 and GOLD was down 1.06% at $2049.80.
_______________________________________________________________________
We are doing many micro Day Trades on our new Discord Trading Hub (free). Please join Discord on your cell phone app for day trading mobile notifications during the day. Other methods of notification have been too slow. Also, please check our our Live Trading Room on YouTube during Market hours.
More action this week on the Day Trading Scrolling Charts, and Day Trading Charts for Indices & Large Caps.
_____________________________________________________________________________________________
MONEY BUYS SOON:
We are in now in 5 logged Swing Trading Positions for the Short & Medium Term. There are 9 investments on the Short Term Watch List.
Be patient and WAIT for Green Zone Buy Signals!
LONG TERM INVESTMENTS:
Long Term Scrolling Charts (Real Time)
Buy Signal this week: RRPIX RISING RATE MUTUAL FUND Long Term Buy Signal on Friday. Target is $46.
ARKK ARK INNOVATION FUND Buy above $54.52 with High Volume with a 3% Trailing Sell Stop Loss below it.
CLSK CLEANSPARK INC. Stage 2 Break Out. Wait for Daily Money Wave Close > 20 with High Volume.
NET CLOUDFLARE INC. Wait for next Daily Money Wave Close > 20 with High Volume.
PINS PINTEREST INC. Stage 2 Break Out above $30.86. Wait for next daily Green Zone Buy cycle.
PLTR PALANTIR TECH Wait for next Weekly Money Wave Close > 20.
S SENTINELONE INC. Wait for Daily Money Wave Close > 20 with High Volume.
TBT INVERSE T-BOND FUND (2X) Still Below the Green Line. Wait for next Daily Money Wave Close > 20.
YETI YETI HOLDINGS Wait for Daily Money Wave Close > 20 with High Volume.
______________________________________________________________________________
My Trading Dashboard
Swing Trading Scrolling Charts
Day Trading Scrolling Charts
Click for Watch Lists
Click for Current Positions
Click for Closed Positions
Updated Top 100 List Jan 1, 2023
Dividend Growth Portfolio
Updated ETF Sector Rotation System
Dogs of the DOW System
Stage Chart Investing
Long Term Strategy for IRAs & 401k Plans
CNN Fear & Greed Index
Scrolling Stage Chart Investing Charts
Alert! Market Risk is High (RED). The probability of successful Short Term Trades is better, when the % of stocks above the 50-day avg. is below 20.
Tell your Friends about the Green Line, and Help Animals.
______________________________________________________________________________
QUESTION: John C. writes “Hi. I have been using your methods with quite good success over the past year, but lately I have been wondering something. Sometimes you post a daily chart for a company, but other times you post a weekly chart. For swing/momentum trading, which chart is best to go by, because looking at both, side to side, the Money Waves are quite different.
Many thanks, John C.
ANSWER: Hi John. The Green Line System is based on Buying the Leaders in the Green Zone, and taking Profits in the Red Zone.
The Daily Chart cycle usually takes 1-3 weeks and the Weekly Chart takes 1-3 months. If you Buy the Weekly, don’t look at the Daily, as the Daily will cycle thru many times and be confusing. Pick only 1 Time Frame, and stick with it.
Many will use a shorter term Time Frame for ENTRY only, then go back to your Main Chart decision.
Thanks for writing.
ATGL
Related Post
– RRPIX


