Watch List and Charts to Buy Soon.
| Daily Swing Watch List to Buy | Daily Swing Charts to Buy |
| Current Daily Swing Positions | Current Swing Charts |
| Closed Daily Swing Results | Trading Dashboard |
1/28/2024 Markets were higher for the week as the Semiconductors and Big 7 soared. But there was some profit taking as Tesla (TSLA) & Intel (INTC) were down sharply on weaker Earnings.
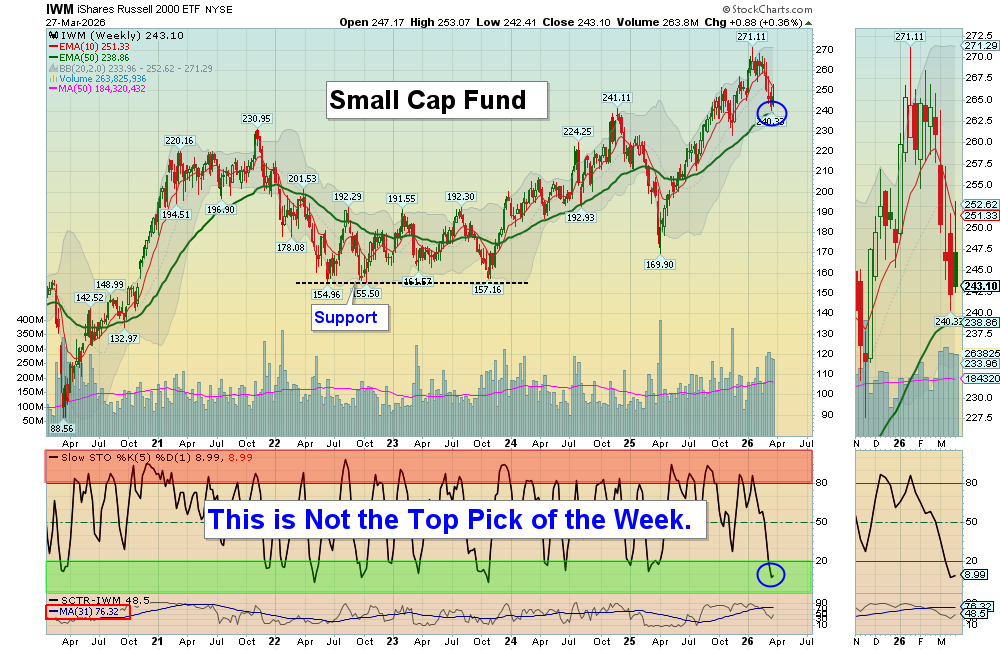
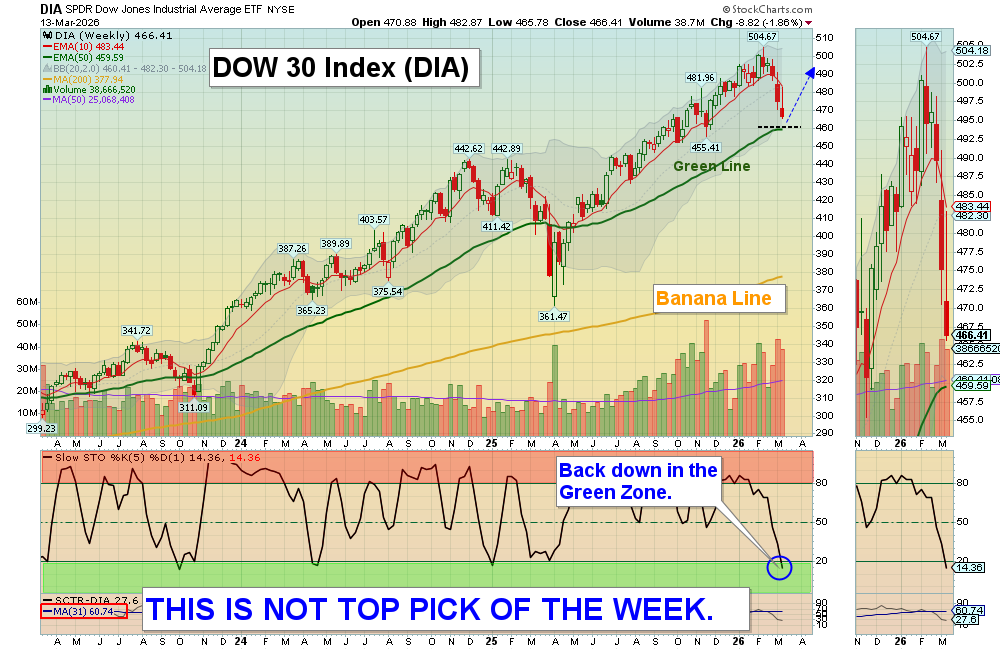
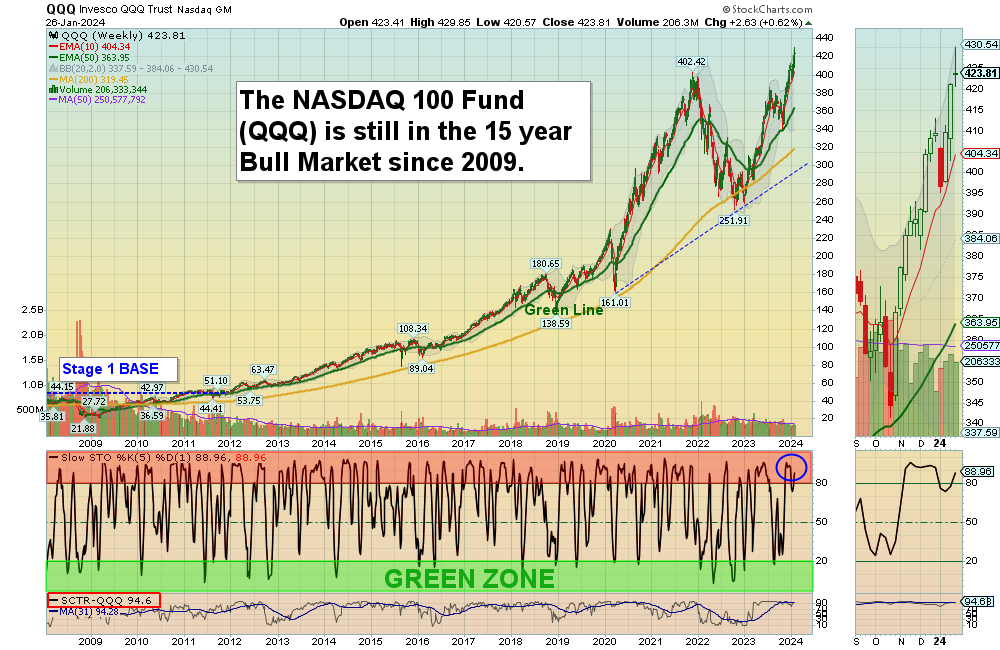
The NASDAQ 100, S&P 500 Indices, DOW 30 & NYSE were able to make higher highs (Bullish), but the weaker Small Caps, ARKK Fund & Transports did not.
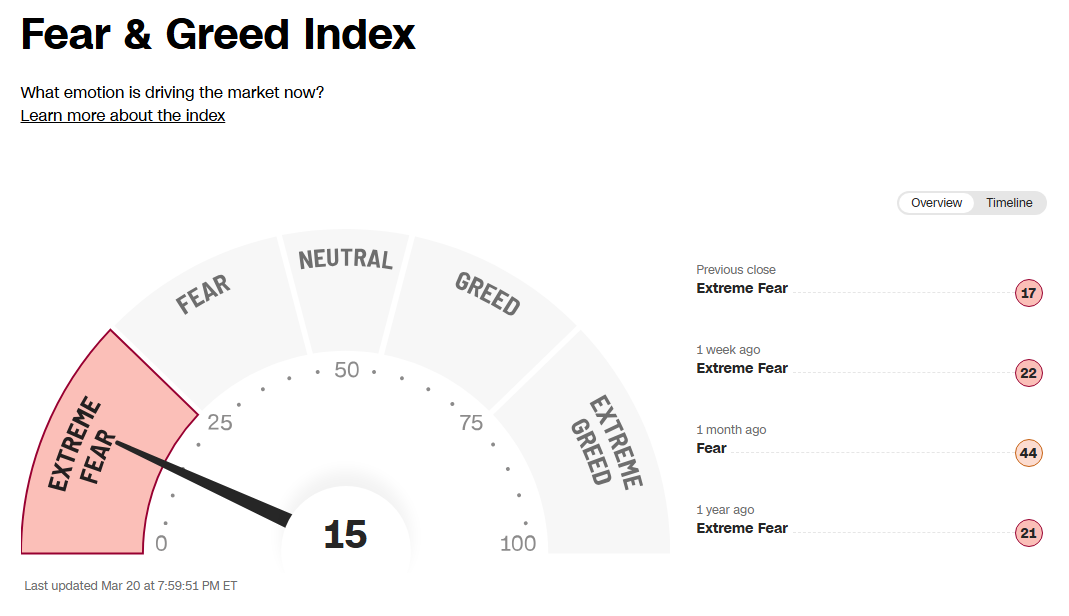
Greed is high now, so be cautious. Remember, we like to Buy on Bad News like in late October, when Bonds were dumping on FEAR.
If you continue to Follow the Green Line System, your Money should flow into the Strongest areas and your account value should be able to grow in both Bull and Bear Markets. Follow the MONEY, not the MEDIA.
______________________________________________________________________________
For the week the Dow was up 0.66%, the S&P 500 was up 1.03% and the NASDAQ 100 was up 0.62%. Many of the major Indices still have a Relative Strength below 80, so you should currently own the stronger Funds here.
The Inflation Index (CRB) was up 3.09% for the week and is Above the Green Line, indicating Economic Expansion.
Bonds were down 0.33% for the week, and are Below the Green Line, indicating Economic Expansion.
The US DOLLAR was up 0.16% for the week and is Below the Green Line.
Crude Oil was up 6.50% for the week at $78.01 and GOLD was down 0.59% at $2017.30.
_______________________________________________________________________
We are doing many micro Day Trades on our new Discord Trading Hub (free). Please join Discord on your cell phone app for the fastest Trade Alerts and Daily email notifications during the day. Other methods of notification have been too slow. Also, please check our our Live Trading Room on YouTube during Market hours.
More action this week on the Day Trading Scrolling Charts, and Day Trading Charts for Indices & Large Caps.
_____________________________________________________________________________________________
MONEY BUYS SOON:
We are in now in 6 logged Swing Trading Positions for the Short & Medium Term. There are 6 investments on the Short Term Watch List.
Be patient and WAIT for Green Zone Buy Signals!
LONG TERM INVESTMENTS:
Long Term Scrolling Charts (Real Time)
CLSK CLEANSPARK INC. Wait for Weekly Money Wave Close > 20 with High Volume.
COIN COINBASE GLOBAL Wait for next Weekly Money Wave Close > 20 with High Volume.
CVNA CARVANA CO. Buy above $62.59 with High Volume with a 3% Trailing Sell Stop Loss below it.
DOCU DOCUSIGN INC. Buy above $69.45 with High Volume with a 3% Trailing Sell Stop Loss below it.
KOPN KOPIN CORP. Buy above $2.50 with High Volume with a 3% Trailing Sell Stop Loss below it.
NET CLOUDFLARE INC. Buy above $86.91 with High Volume with a 3% Trailing Sell Stop Loss below it.
PINS PINTEREST INC. Stage 2 Break Out above $30.86. Wait for next daily Green Zone Buy cycle.
S SENTINELONE INC. Wait for Daily Money Wave Close > 20 with High Volume.
TBT INVERSE T-BOND FUND (2X) Back Above the Green Line. Wait for next Daily Money Wave Close > 20. ______________________________________________________________________________
My Trading Dashboard
Swing Trading Scrolling Charts
Day Trading Scrolling Charts
Click for Watch Lists
Click for Current Positions
Click for Closed Positions
Updated Top 100 List Jan 1, 2023
Dividend Growth Portfolio
Updated ETF Sector Rotation System
Dogs of the DOW System
Stage Chart Investing
Long Term Strategy for IRAs & 401k Plans
CNN Fear & Greed Index
Scrolling Stage Chart Investing Charts
| Top 100 | Stage Chart Investing | CNN Fear & Greed Index |
| Dividend Growth Portfolio | ETF Sector Portfolio | Dogs of the Dow |
| Long Term Strategy | Stage Chart Investing | Articles |
Alert! Market Risk is High (RED). The probability of successful Short Term Trades is better, when the % of stocks above the 50-day avg. is below 20.
Tell your Friends about the Green Line, and Help Animals.
______________________________________________________________________________
QUESTION: Arvind writes “I joined Green Line 2 days ago. How do I get a chart of my chosen ticker symbol?”
ANSWER: Hi Arvind, if you go down to the link on the Daily emails: ARE YOUR INVESTMENTS ABOVE THE GREEN LINE? you can pull up your own Charts.
Thank you,
ATGL
Related Post
– CLSK