
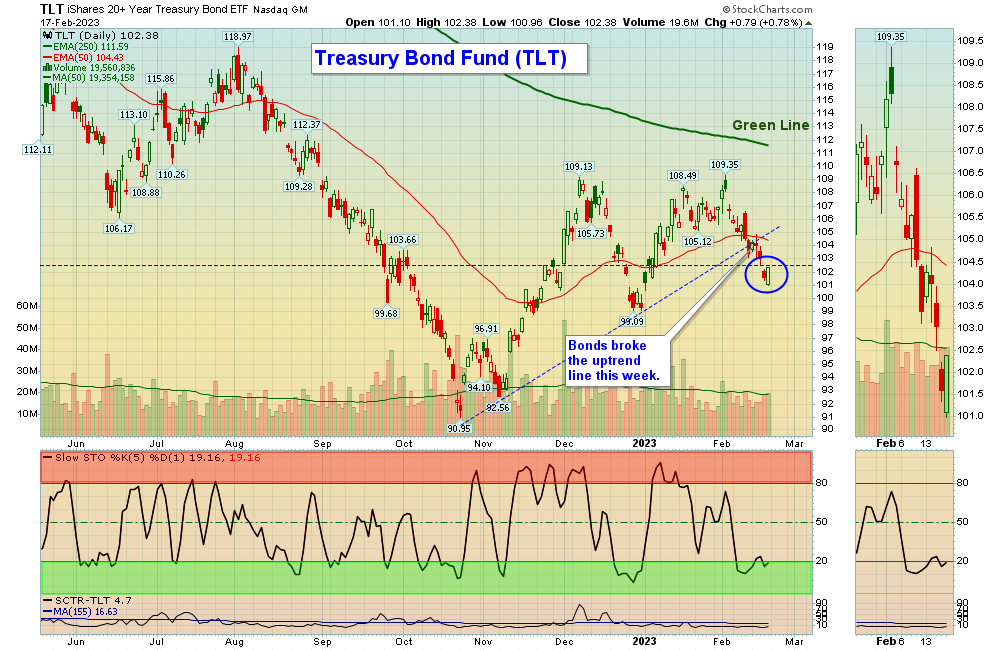
2/19/2023 Markets were mixed after dropping from the highs when long term Interest Rates rose. Treasury Bond prices rolled over on higher Inflation news. But so far the long term Interest Rates are going up very slowly to retest the high of 4.42%.
The major Stock Indices are all back Above the Green Lines, but are still over bought on the weekly chart. Markets reached a panic buying stage in January on FOMO (Fear of missing Out & Greed).
If you continue to Follow the Green Line System, your Money should flow into the Strongest areas and your account value should be able to grow in both Bull and Bear Markets. Follow the MONEY, not the MEDIA..
______________________________________________________________________________________________________________________________________________
For the week the Dow was up 0.03%, the S&P 500 was down 0.28% and the NASDAQ 100 was up 0.49%. Most of the major Indices do not have Relative Strength above 80, so you should currently own the stronger Securities here.
The Inflation Index (CRB) was down 1.87% for the week and is Below the Green Line, indicating Economic Contraction.
Bonds were down 0.98% for the week, and are Below the Green Line, indicating Economic Expansion.
The US DOLLAR was up 0.24% for the week and is Below the Green Line.
Crude Oil was down 3.98% for the week at $76.55 and GOLD was down 1.30% at $1850.20.
More action this week on the Day Trading Scrolling Charts. and Live Streaming.
DAY TRADING CHARTS FOR INDICES & LARGE CAPS.
We have not had many intra-day Trade Alert signals lately as the Volume has been too Low with the Buy Signals (FED is still tightening). These low Volume Buy Signals tend to pop up and quickly fade back down. We like to see High Volume on rallies. Please check our our Live Streaming during Market hours.
_____________________________________________________________________________________________
MONEY WAVE BUYS SOON:
We are in now in 6 logged Swing Trading Positions for the Short & Medium Term. There are 3 investments on the Short Term Watch List.
Be patient and WAIT for Green Zone Buy Signals!
LONG TERM INVESTMENTS: (It is still hard to find many Long Term now because most normal Investments no longer have 80 Relative Strength required.)
Long Term Scrolling Charts (Real Time)
CHWY CHEWY INC. Buy above $52.88 with High Volume with a 3% Trailing Sell Stop Loss below it.
COP CONOCO PHILLIPS Wait for Weekly Money Wave Close > 20 with High Volume.
GIS GENERAL MILLS INC. Wait for Weekly Money Wave Close > 20 with High Volume.
SH INVERSE S&P 500 FUND Wait for Weekly Money Wave Close > 20 with High Volume.
TAL TAL EDUCATION GROUP Buy above $10.45 with High Volume with a 5% Trailing Sell Stop Loss below it.
TWNK HOSTESS BRANDS Buy above $23.49 with High Volume with a 3% Trailing Sell Stop Loss below it.
______________________________________________________________________________________________________
My Trading Dashboard
Swing Trading Scrolling Charts
Day Trading Scrolling Charts
Click for Watch Lists
Click for Current Positions
Click for Closed Positions
Updated Top 100 List Feb 1, 2023
Dividend Growth Portfolio
Updated ETF Sector Rotation System
Dogs of the DOW System
Long Term Strategy for IRAs & 401k Plans
CNN Fear & Greed Index
Scrolling Stage Chart Investing Charts
Alert! Market Risk is Medium (YELLOW). The probability of successful Short Term Trades is better, when the % of stocks above the 50-day avg. is below 20.
Tell your Friends about the Green Line, and Help Animals.
________________________________________________________________________________
QUESTION: CDS writes “Are you moving from Trailing % Stops $ Stops on some of these holdings? Clarification please?
ANSWER: We have been missing many Money Wave Buys that ended up being 5-10% higher on the Close. So lately we have been placing specific Target Prices on trades to Capture the Gains.
Please monitor the WATCH LIST and CURRENT POSITIONS pages before making a trade, as they are constantly updated during the day.
Related Post
– CHWY


