
Watch List and Charts to Buy Soon.
| Daily Swing Watch List to Buy | Daily Swing Charts to Buy |
| Current Daily Swing Positions | Current Swing Charts |
| Closed Daily Swing Results | Trading Dashboard |
12/17/2023 Markets were sharply higher for the week, as the FED promised to lower short term Interest Rates next year. T-Bonds were up sharply, but so was Gold (New High). Historically one of them is wrong.
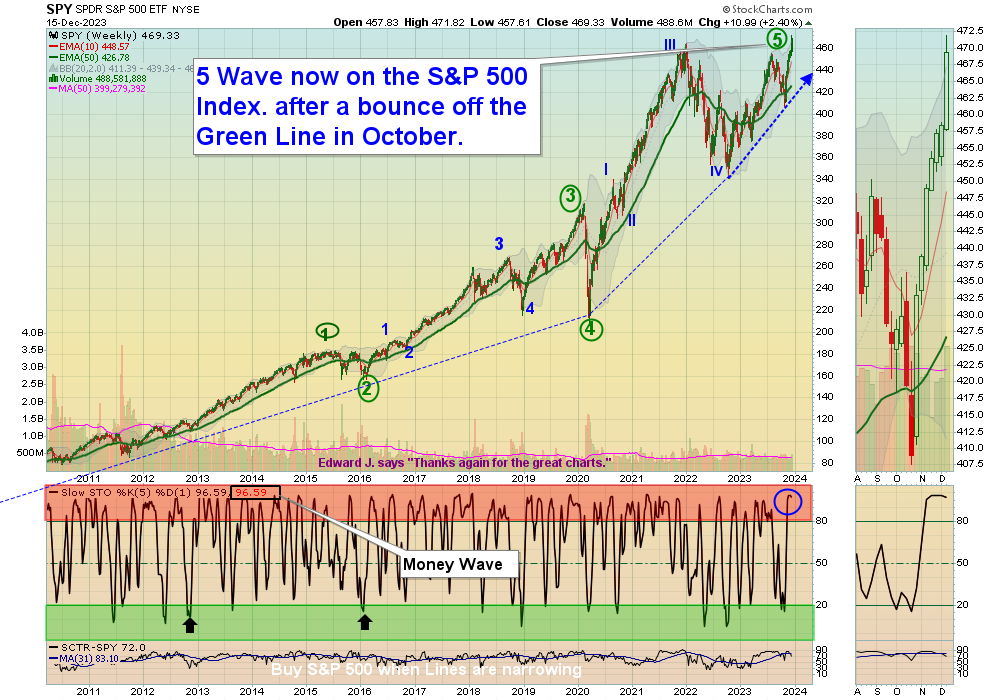
The Herd is “ALL IN” now as the Fed told them what they want to hear (GOOD NEWS). Normally Smart Money Sells on Good News, and Buys on Bad News (like in October). This week both long term Interest Rates & Commodities are Below the Green Lines, indicating Economic Contraction. Maybe the FED has over tightened, and the current Inflation Fears could turn into Deflation (falling prices) on a slowing Economy and lower demand. Or you can believe the opposite from the Media… (Follow the Money, not the Media).
Currently the Herd is panic Buying Stocks Way Above the Green Line on FOMO (Fear of Missing Out), but we know that Stocks will return again to the Green Line. We are raising CASH to Buy Stocks lower on the next Fear Flush.
If you continue to Follow the Green Line System, your Money should flow into the Strongest areas and your account value should be able to grow in both Bull and Bear Markets. Follow the MONEY, not the MEDIA.
______________________________________________________________________________
For the week the Dow was up 2.85%, the S&P 500 was up 2.40% and the NASDAQ 100 was up 3.36%. Many of the major Indices still have a Relative Strength below 80, so you should currently own the stronger Funds here.
The Inflation Index (CRB) was up 0.85% for the week and is Below the Green Line, indicating Economic Contraction.
Bonds were up 5.21% for the week, and are Above the Green Line, indicating Economic Contraction.
The US DOLLAR was down 1.73% for the week and is Below the Green Line.
Crude Oil was up 0.77% for the week at $71.78 and GOLD was up 1.05% at $2035.70, a New High.
_______________________________________________________________________
We are doing many micro Day Trades on our new Discord Trading Hub (free). Please join Discord on your cell phone app for day trading mobile notifications during the day. Other methods of notification have been too slow. Also, please check our our Live Trading Room on YouTube during Market hours.
More action this week on the Day Trading Scrolling Charts, and Day Trading Charts for Indices & Large Caps.
_____________________________________________________________________________________________
MONEY BUYS SOON:
We are in now in 4 logged Swing Trading Positions for the Short & Medium Term. There are 4 investments on the Short Term Watch List.
Be patient and WAIT for Green Zone Buy Signals!
LONG TERM INVESTMENTS:
Long Term Scrolling Charts (Real Time)
AI C3 AI INC. Buy above $31.65 with High Volume with a 3% Trailing Sell Stop Loss below it.
CLSK CLEANSPARK INC. Stage 2 Break Out. Wait for Daily Money Wave Close > 20 with High Volume.
PINS PINTEREST INC. Stage 2 Break Out recently above $30.86. Wait for next daily Green Zone Buy cycle.
RIG TRANSOCEAN INC. Buy above $7.05 with High Volume with a 3% Trailing Sell Stop Loss below it.
RRPIX RISING RATE MUTUAL FUND Below Green Line. Wait for next Weekly Money Wave Close > 20.
TBT INVERSE T-BOND FUND (2X) Below Green Line. Wait for next Weekly Money Wave Close > 20.
__________________________________________________________________________________________
My Trading Dashboard
Swing Trading Scrolling Charts
Day Trading Scrolling Charts
Click for Watch Lists
Click for Current Positions
Click for Closed Positions
Updated Top 100 List Dec 1, 2023
Dividend Growth Portfolio
Updated ETF Sector Rotation System
Dogs of the DOW System
Stage Chart Investing
Long Term Strategy for IRAs & 401k Plans
CNN Fear & Greed Index
Scrolling Stage Chart Investing Charts
Alert! Market Risk is High (RED). The probability of successful Short Term Trades is better, when the % of stocks above the 50-day avg. is below 20.
Tell your Friends about the Green Line, and Help Animals.
______________________________________________________________________________
QUESTION: Winter writes ““Don’t take a Loss” confuses me. What does that mean?”
ANSWER: When the Investment has a Money Wave Buy Signal, it should pop up 3-6 % in just a few days.
If it is not popping up well, and the Money Wave > 50, plan to Get out soon , and Don’t Take a Loss! (Get Out Even).
Something must be Wrong. There will be plenty more Money Wave Signals soon… Raise Cash, and don’t get Stuck! Wait for the next one.
Good trading and tell your friends!
ATGL
