
12/11/2022 Markets were lower for the week as the major Indices were over-bought from a 19% rally up from the Oct. lows. The Fed should tighten another 1/2 point on short term Interest Rates after the FED Meeting on Wednesday Dec. 14th. For the Markets to go higher, the FED needs to stop tightening and talk about the end of tightening. before the economic slow down gets worse.
Currently the major Indices are back down in the Green Zones (probably too late to Sell for the short term), We could see a bounce up to re-test last week’s high. The Strongest Index is the Dow 30, also big Pharma and Energy.
The US Dollar and long term Interest Rates have come down, as the Economy has weakened from FED Tightening. But the Dollar and long term Interest Rates should have enough upward momentum to go back up and re-test the recent highs again (UUP & TBT Buy Signals soon). Don’t be surprised if the Media creates another FEAR cycle again.
If you continue to Follow the Green Line System, your Money should flow into the Strongest areas and your account value should be able to grow in both Bull and Bear Markets. Follow the MONEY, not the MEDIA.
________________________________________________________________________________________________________________________________________________
For the week the Dow was down 2.72%, the S&P 500 was down 3.35% and the NASDAQ 100 was down 3.59%. Most of the major Indices do not have Relative Strength above 80, so you should currently own the stronger Securities here.
The Inflation Index (CRB) was down 3.56% for the week and is Below the Green Line, indicating Economic Contraction.
Bonds were down 0.71 % for the week, and are Below the Green Line, indicating Economic Expansion.
The US DOLLAR was up 0.29% for the week and is down near the Green Line.
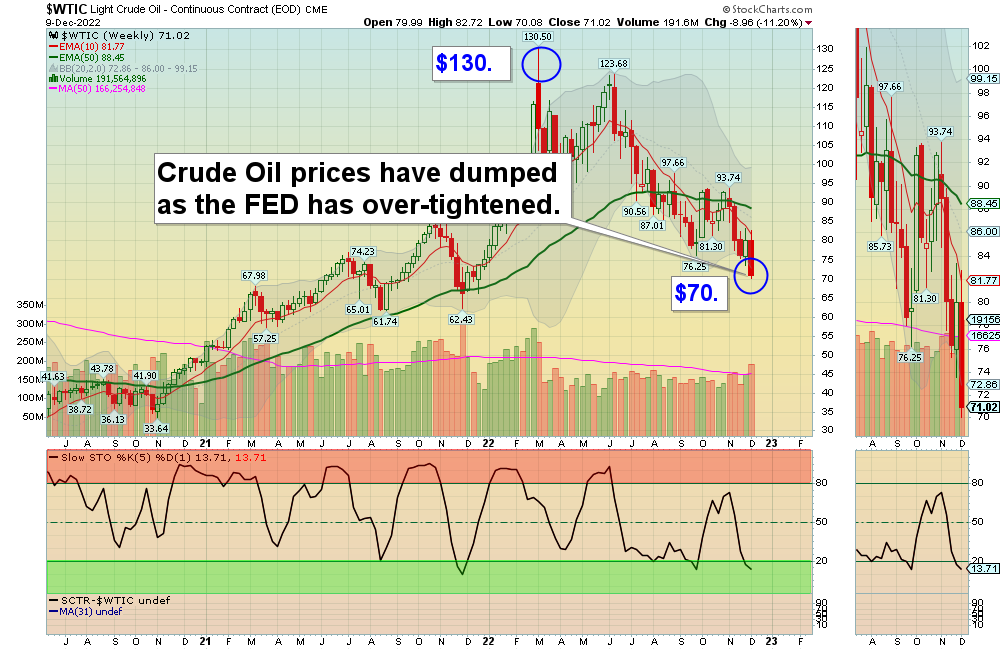
Crude Oil was down 11.20% for the week at $71.02 and GOLD was up 0.06% at $1810.70.
More action this week on the Day Trading Scrolling Charts.
DAY TRADING CHARTS FOR INDICES & LARGE CAPS.
We have not had many intra-day Trade Alert signals lately as the Volume has been too Low with the Buy Signals. These low Volume Buy Signals tend to pop up and quickly fade back down. We like to see High Volume on rallies.
_____________________________________________________________________________________________
MONEY WAVE BUYS SOON:
We are in now in 5 logged Current Positions for the Short & Medium Term. There are 7 investments on the Short Term Watch List.
Be patient and WAIT for Green Zone Buy Signals!
LONG TERM INVESTMENTS: (It is still hard to find many Long Term now because most normal Investments no longer have 80 Relative Strength required.)
Long Term Scrolling Charts (Real Time)
COP CONOCO PHILLIPS Wait for the next Weekly Money Wave Buy Signal.
CROX CROX INC. Wait for the next Daily Money Wave Buy Signal.
TBF INVERSE T-BOND FUND Wait for the next Weekly Money Wave Buy Signal.
UUP US DOLLAR FUND Wait for the next Weekly Money Wave Buy Signal.
VIPS VIPSHOP HOLDINGS Buy if it Closes above $13.32 with High Volume. (now in Stage 1 Base).
______________________________________________________________________________________________________
My Trading Dashboard
Swing Trading Scrolling Charts
Day Trading Scrolling Charts
Click for Watch Lists
Click for Current Positions
Click for Closed Positions
Updated Top 100 List Dec 1, 2022
Dividend Growth Portfolio
Updated ETF Sector Rotation System
Dogs of the DOW System
Long Term Strategy for IRAs & 401k Plans
CNN Fear & Greed Index
Scrolling Stage Chart Investing Charts
Alert! Market Risk is High (RED). The probability of successful Short Term Trades is better, when the % of stocks above the 50-day avg. is below 20.
Tell your Friends about the Green Line, and Help Animals.
________________________________________________________________________________
QUESTION: Jackie writes “Been reading your informative articles and FAQs. Is there a way I can enter a stock such as BA or an ETF symbols and see them shown as ATGL chart with red/green zones, MAs, sector ranking, Green Line etc?”
ANSWER: Yes. Near the bottom of each Daily email, look for: ARE YOUR INVESTMENTS ABOVE THE GREEN LINE?
Please Click on the link (To make the Chart larger, please change the SIZE to Landscape and then Update.)
Good trading and tell your friends!
Related Post
– CROX


