Above the Green Line -01
  • Market Insights
        • Commentary
          • Daily
          • Weekly
        • BUY / SELL SIGNALS
          • Trade Posts
          • Recent Trade Alerts
          • Recent Day Trades
        • BLOGROLL
          • Dividend Growth Blog
          • ETF Sector Blog
          • Dow Dogs
          • TPOW Blog
  • Strategies
        • SWING TRADING
          • Current Positions
          • Watchlists
          • Closed Positions
          • Candidates - TOP 100
          • Specialty Stocks
        • WEEKLY STOCK PICK
          • TPOW Charts
          • TPOW Performance
          • TPOW Strategy Guide
          • TPOW Performance Dashboard
        • DAY TRADING
          • Watch List
        • ATGL DASHBOARD
        • ETF STRATEGIES
          • ETF Sector Rotation
          • ETF Sector Portfolio
        • DIVIDEND GROWTH
          • Dividend Growth Portfolio
          • Dividend Calendar
        • DOGS OF THE DOW
          • Dogs of the Dow Portfolio
          • DOW 5 Portfolio
  • Markets
        • US MARKET
          • Commodities
          • Energy
          • Precious Metals
          • Volatility
        • GLOBAL MARKETS
          • Market Indices
          • Economic Calendar
          • FOREX Heat Map
          • FOREX Cross Rates
          • Crypto Currency Market
  • Investing
    • Discord Community
    • Dashboard
  • Resources
        • ARTICLES
          • Dividend Growth Model Articles
          • ETF Articles
          • Investment Strategies Articles
          • Market and Economic Insights
          • Stock Trade Articles
          • Stock Reviews
        • TOOLS
          • Stock Scanners
          • Charting Software
          • Brokerage Firms
        • STOCK CHARTS
          • Key Components
          • Reading Charts
          • Drawing Stock Charts
          • Identifying Trends
        • RETIREMENT PLANNING
  • About
    • Contact Us
    • How to Win
    • #1 At Stockcharts
    • Disclaimer
    • FAQ
  • Log In
  • Subscribe

April 10, 2022

Green Line Weekly Apr 10, 2022

SPY Chart
The S&P 500 Index should bounce up off the Red Line (50-day avg.)

4/10/2022 Markets were lower for the week as longer term Interest Rates surged higher. Now Long Term Treasury Bonds are down 25% from the 2020 High. T-Bonds are 12 % Below the Green Line on emotional FEAR Selling by Tammy and unsophisticated followers of the Bad News Media. Falling T-Bond prices has caused higher Interest Rates, which could slow down the housing Market as many will no longer be able to qualify.

The Herd is worried about inflation and the FED raising the Fed Funds rate many times this year. But soon the T-Bond market should love this, because tightening by the FED should slow things down. T-Bonds like slow growth and low Inflation. Historically high Interest Rates and Commodity Prices will cause a slow down, and then FED will probably change directions again.

You were warned 2 years ago that all of the FED Printing would cause Inflation.  But the FED kept Printing. Now they are going to put on the brakes and cause deflation? Forget the FED, and FOLLOW the MONEY. 

Currently the tangible Commodities are Way Above the Green Lines, and Bonds are Way Below the Green Lines. Both will eventually return to the Green Lines, so maybe we will see a Stock Market rally when Interest Rates and Inflation fall.

If you continue to Follow the Green Line System, your Money should flow into the Strongest areas and your account value should be able to grow in both Bull and Bear Markets.   

Still slower action this week on the Day Trading Scrolling Charts.  

DAY TRADING CHARTS FOR INDICES & LARGE CAPS.

We have not had many intra-day Trade Alerts lately as the Volume has been too Low with the Buy Signals. We like to see High Volume on rallies.

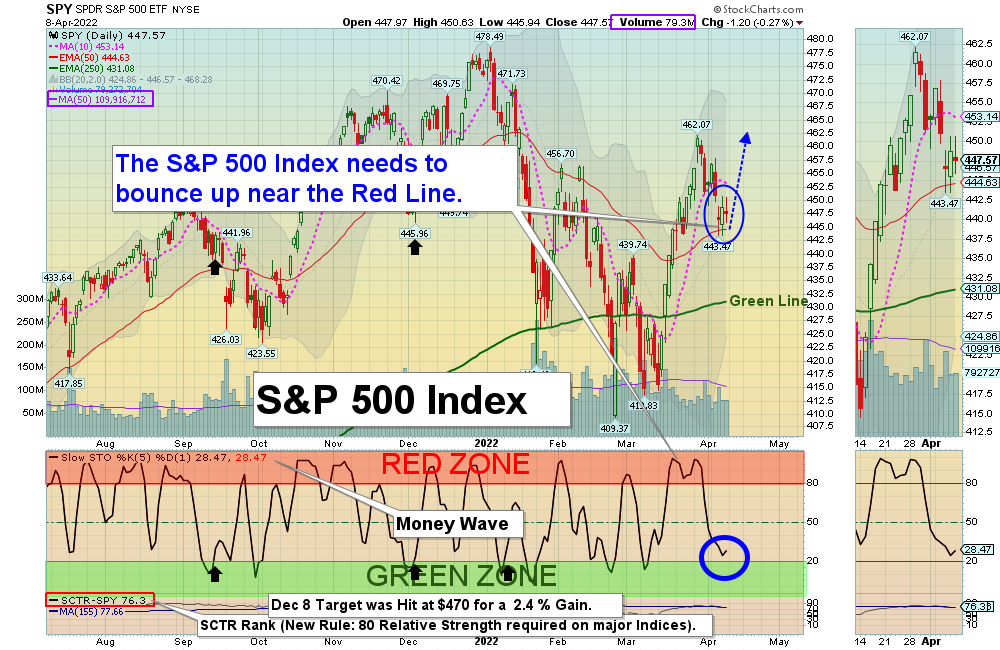
For the week the Dow was down 0.18%, the S&P 500 was down 1.18%, and the NASDAQ 100 was down 3.51%. The Long Term Trend for the Indices is up. 

The Inflation Index (CRB) was up 1.71% for the week and is Above the Green Line, indicating Economic Expansion.

Bonds were down 5.48% for the week, and are Below the Green Line, indicating Economic Expansion.

The US DOLLAR was up 1.14% for the week and is Above the Green Line. 

Crude Oil was down 1.02% for the week at $98.26 and GOLD was up 1.14%  at $1945.60. 

SEE SUPPLEMENTAL CHARTS

_____________________________________________________________________________________________

MONEY WAVE BUYS SOON

We are in only 3 logged Current Positions for the Short & Medium Term, and we have  CASH to Buy 7 more soon.  There are 9 investments on the Short Term Watch List. 

Be patient and WAIT for Green Zone Buy Signals!

_________________________________________________________________________________________

LONG TERM INVESTMENTS  (Hard to find Large Caps because most no longer have 80 Relative Strength required.)

Long Term Scrolling Charts (Real Time)   

F      FORD MOTOR CO.       Buy if it Closes above $17.80 with High Volume.    

RRPIX       RISING INTEREST RATES FUND      Buy above $30.20 with a 5% Trailing Sell Stop Loss below it.   

________________________________________________________________________________

My Trading Dashboard
Swing Trading Scrolling Charts
Day Trading Scrolling Charts

Click for  Watch Lists
Click for  Current Positions
Click for  Closed Positions

Updated Top 100 List Apr 2, 2022
Dividend Growth Portfolio  
Updated ETF Sector Rotation System      
Dogs of the DOW System
Long Term Strategy for IRAs & 401k Plans
CNN Fear & Greed Index
Scrolling Stage Chart Investing Charts

Alert! Market Risk is MEDIUM (Yellow). The probability of successful Short Term Trades is better, when the % of stocks above the 50-day avg. is below 20. 

Tell your Friends about the Green Line, and Help Animals.

________________________________________________________________________________

Brian C. writes “You guys are great.  I have only done a few trades since last Wednesday.  Your charting has helped me refine quite a few things I have learned from Minervini and William O’Neil.
I have made a few bucks this week and an happy to share this with you:  Thank you for supporting the ASPCA! We have successfully processed your gift of $100.00.”
Brian C.

Related Post

– Green Line Weekly Apr 3, 2022

Subscribe to Our Newsletter

AGL Logo

Get our eBook Now!

Candlestick - A Swing Traders Friend

We don’t spam! Read our privacy policy for more info.

You’ve been successfully subscribed to our newsletter!

Voted #1 at Stock Charts

SH Chart
Inverse S&P 500 Fund (SH) will have a Money Wave Buy today.

Help Us Help Animals

Help Us Help Animals

Recent Comments

  • Market Breadth Indicators: A Trader’s Guide to Early Trend Detection on Backtesting: Definition and How a Trading Strategy Backtest Works
  • Island Reversal Pattern: Definition and Formation Explained on Double Top Pattern: How to Identify and Trade This Reversal Signal
  • Channel Pattern Guide: What It Is and Why It Matters on A Guide to Forecasting Using Moving Averages
  • What Is a Broadening Bottom Chart Pattern? Full Guide on Bull vs. Bear Market: An Investor’s Guide to Market Phases
  • ATGL Weekly Money Flow - 2025-05-11 on ATGL Top Pick of the Week! Apr 6, 2025

Become a Green Liner!

Help me make more Money in the Stock Market.

ON ATGL

  • DashBoard
  • Weekly Commentary
  • Daily Buy / Sell Signals
  • Day Trade Setup
  • Trading Rooms

Design & Develop By Pixelvect

STRATEGIES

  • Swing Trading
  • ATGL Pick of the Week
  • Dividend Growth
  • ETF Sector Rotation
  • Dogs of the Dow

HELP

  • ATGL Trading Rules
  • FAQ
  • Account Maintenance
  • Contact US
  • Join

FOLLOW US

Instagram Linkedin Twitter Facebook

© COPYRIGHT 2024 · ABOVETHEGREENLINE.COM · ALL RIGHTS RESERVED · PRIVACY · TERMS · CONTACT · WATCHLIST · CURRENT