By Andrew Stowers
Updated May 25, 2026
Most lists of the best indicators for day trading share the same flaw: they describe what each indicator calculates without explaining what trading decision it actually supports. The result is traders stacking 8-10 indicators on a single chart, many measuring the same thing from slightly different angles, creating noise instead of signal.
This guide takes a different approach. Each of the 7 indicators here was selected because it answers a specific question that the others don’t. And the final section shows how they form a coherent, layered system — not an arbitrary collection. After reading this article, if you want to explore our perspective on investment strategies, we encourage you to check out our Investment Strategy Guide.
The 7 best indicators for day trading, in order of application:
- VWAP — establishes intraday bias and key reference levels
- 9 and 20 EMA — identifies short-term trend direction and dynamic support
- MACD — confirms momentum and signals shifts before price confirms them
- Volume — validates whether price moves have real participation behind them
- Relative Volume (RVOL) — identifies exceptional setups vs normal market noise
- ATR — determines stop placement and realistic position sizing
- Market Internals (TICK, ADD, TRIN) — provides broader market context
How to Choose Day Trading Indicators: The Framework Before the List
| The Core Principle
Experienced day traders use 3-5 indicators maximum, each chosen to answer a different question. Adding RSI, MACD, and Stochastic to the same chart does not provide three signals — all three are momentum oscillators measuring the same thing from slightly different angles. More indicators create confirmation bias and decision paralysis, not additional edge. |
Every indicator on your chart should answer one of six trading questions — and no two indicators should be answering the same question:
- Context: Is the broader market environment supportive of my trade direction?
- Bias: Am I on the right side of today’s intraday trend?
- Trend: What is the short-term trend direction and where is dynamic support/resistance?
- Momentum: Is the trend gaining or losing strength?
- Confirmation: Is volume validating this price move?
- Risk: How much room does this stock need before my stop is wrong?
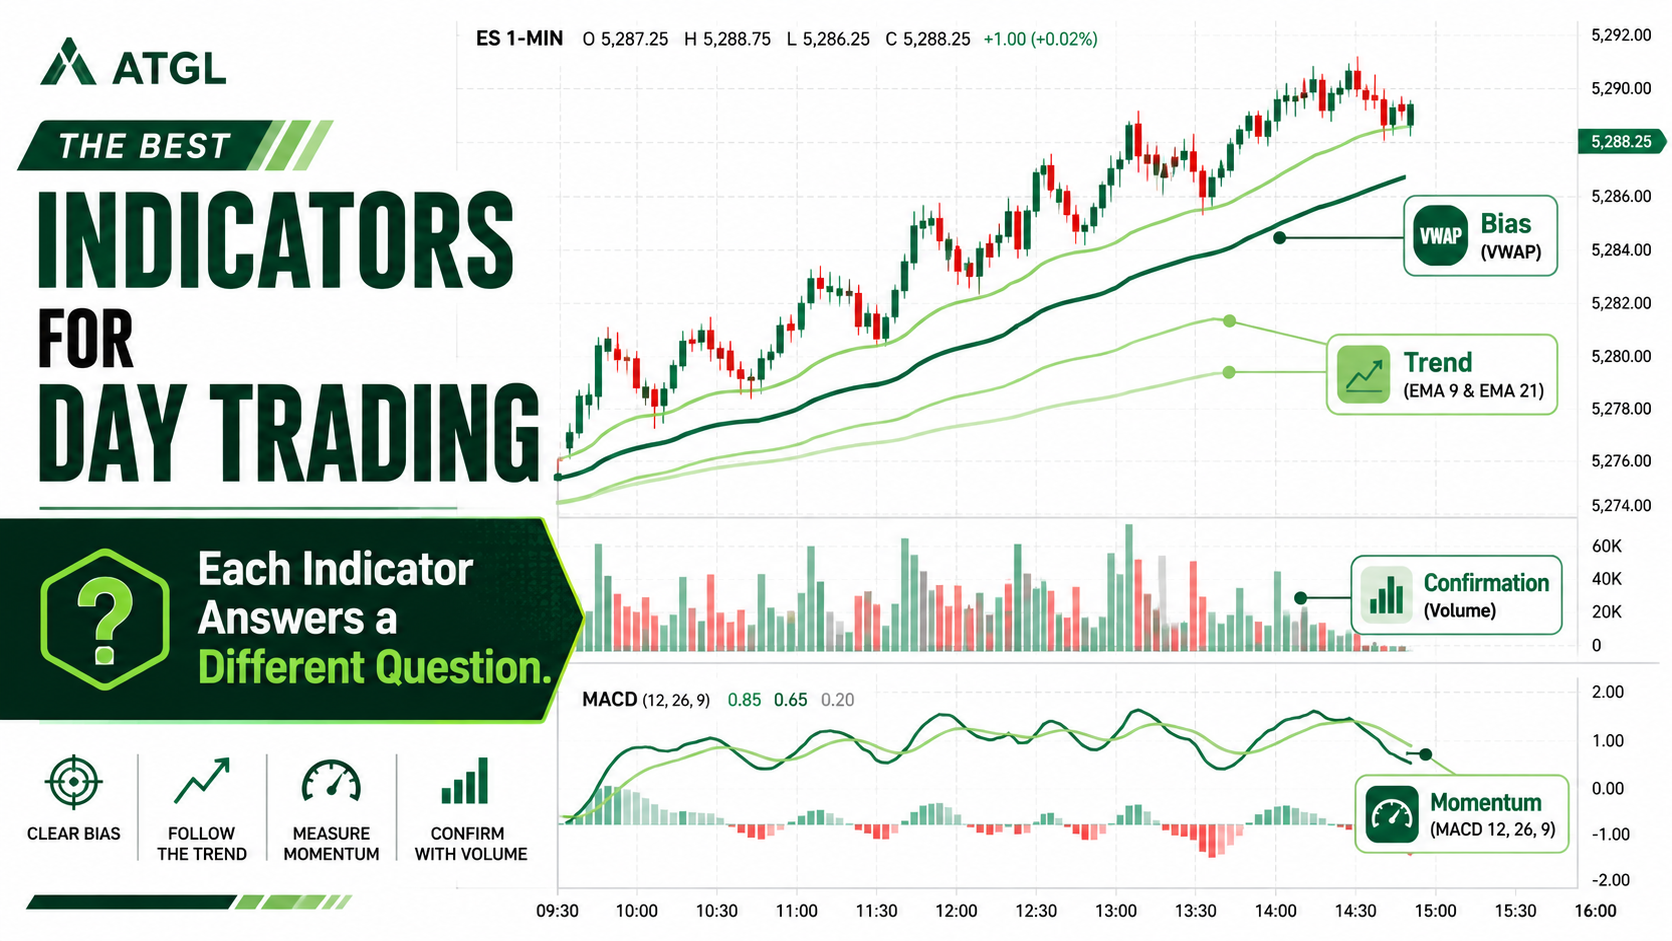
The seven indicators in this guide map to those six questions: Market Internals answer context; VWAP answers bias; EMA answers trend; MACD answers momentum; Volume and RVOL answer confirmation; ATR answers risk. Price action — reading the raw price bars — provides the entry trigger.
Why Day Trading Indicators Are Different
Day trading operates on intraday charts (1-minute, 5-minute, 15-minute). The indicators that work for position trading — 50-day moving averages, weekly RSI, multi-month MACD — are too slow for intraday decisions. VWAP resets every session and only applies intraday. Market Internals provide real-time market condition data. ATR must reflect intraday volatility, not multi-week ranges. The indicators suited to day trading are a specific subset of the broader technical analysis universe.
Indicator 1: VWAP — The Day Trader’s Most Important Intraday Level
| What It Answers
VWAP answers the bias question: am I trading on the right side of today’s session? Price above VWAP = bullish intraday bias. Price below VWAP = bearish intraday bias. This is the starting point of every intraday analysis. |
VWAP — Volume Weighted Average Price — calculates the average price at which a security has traded throughout the session, weighted by the volume executed at each price level. It resets at the start of every trading session and only applies to intraday charts.
Why VWAP carries institutional weight: institutional traders — funds, market makers, and algorithmic strategies executing large orders — use VWAP as a benchmark for execution quality. Buying below VWAP means your average cost is below the institutional average; selling above VWAP means you captured above the institutional average. This institutional grounding is what makes VWAP the most reliable intraday reference level available to retail traders.
Four Key VWAP Patterns
- VWAP reclaim: price dips below VWAP, then reclaims it with volume — bullish continuation signal on uptrending sessions
- VWAP rejection: price fails to reclaim VWAP after a reclaim attempt — confirms bearish bias for the session
- VWAP hold: price pulls back to VWAP on a trending move and bounces — continuation entry on strong trend days
- VWAP break: price breaks below VWAP on above-average volume — trend change signal
VWAP Standard Deviation Bands
Most VWAP implementations include upper and lower standard deviation bands (1x and 2x SD). Price reaching the 2nd standard deviation above VWAP signals a potentially extended move prone to mean reversion. Price rejecting the 2nd SD below VWAP signals potential short-term exhaustion. These bands provide quantified overextension levels.
For an extended guide on anchored VWAP — calculating VWAP from a specific price anchor like a prior day’s high or a gap — see ATGL’s dedicated analysis.
Indicator 2: The 9 and 20 EMA — Dynamic Intraday Trend Levels
| What It Answers
The 9 and 20 EMA answer the trend question: what is the short-term direction, and where is dynamic intraday support or resistance? When the 9 EMA is above the 20 EMA and both are rising, the short-term trend is bullish and pullbacks to these levels are potential entries. |
Exponential moving averages weight recent price action more heavily than older data — making them faster to respond to momentum shifts than simple moving averages (SMAs). For day trading, where conditions can change within minutes, this responsiveness is essential. SMAs respond too slowly to intraday movement to be useful as entry signals.
The 9 EMA: Fast Momentum Signal
The 9-period EMA is the fastest short-term momentum gauge. Price holding above a rising 9 EMA signals strong momentum; a cross below the 9 EMA is the first warning of momentum fading. On 1-minute and 5-minute charts, many day traders use the 9 EMA as their primary pullback entry level on strong momentum stocks — a stock pulling back to the 9 EMA during an uptrend is potentially setting up for continuation.
The 20 EMA: Slower Support Level
The 20 EMA provides a slightly wider, more stable dynamic level — often acting as the key pullback entry on higher-quality setups. When a stock pulls back through the 9 EMA but holds the 20 EMA, then reclaims the 9 EMA, it signals a higher-conviction continuation entry than a simple 9 EMA touch.
The 9/20 EMA Relationship
9 EMA above 20 EMA, both rising: bullish trend; favour long setups at pullbacks to the 9 EMA or 20 EMA.
9 EMA below 20 EMA, both declining: bearish trend; favour short setups at rallies to the 9 EMA or 20 EMA.
When the 9 EMA crosses above the 20 EMA on the 5-minute chart, it signals strengthening short-term momentum — this cross is used by many traders as an entry signal in the direction of the developing trend. For detailed calculations and additional EMA applications, see ATGL’s full exponential moving average guide.
Indicator 3: MACD — Momentum Confirmation for Day Traders
| What It Answers
MACD answers the momentum question: is the current trend gaining or losing strength? The histogram — the difference between the MACD line and signal line — often signals momentum shifts before they are visible in price, giving day traders early warning of potential reversals. |
MACD (Moving Average Convergence Divergence) measures momentum by comparing fast and slow EMAs and plotting their difference. The three components: the MACD line (fast EMA minus slow EMA), the signal line (EMA of the MACD line), and the histogram (MACD line minus signal line).
Intraday MACD Settings
The default MACD settings (12/26/9) are calibrated for daily price charts. For intraday day trading on 1-minute and 5-minute charts, many traders use faster settings: 3/10/16 or 5/13/1. These faster settings improve responsiveness to intraday momentum shifts at the cost of more noise. The right setting depends on your timeframe and trading style — test before committing.
The Histogram as Early Warning
The MACD histogram is the most actionable element for day traders — more useful than the standard crossover signal. When the histogram is expanding (bars getting taller), momentum is increasing in the current direction. When the histogram begins to shrink despite price continuing in the same direction, momentum is fading — a potential reversal is developing before it is visible in the price bars.
This divergence — shrinking histogram while price makes higher highs — is one of the most reliable early warning signals in day trading and one of the most commonly overlooked.
The Zero Line as a Filter
MACD trading above the zero line indicates overall bullish momentum for the instrument on that timeframe; below the zero line indicates bearish. Higher-probability trades are taken in the direction of the zero-line position — long trades when MACD is above zero, short trades when below. Counter-trend signals in MACD have lower success rates and should be filtered accordingly.
Indicators 4 and 5: Volume and Relative Volume — Confirming Every Move
| What It Answers
Volume and RVOL answer the confirmation question: is real participation behind this price move? High-volume breakouts and breakdowns are significantly more reliable than low-volume ones. RVOL identifies the exceptional setups — stocks trading far above their normal volume — that create sustained directional moves. |
Standard Volume: The Most Underrated Indicator
Volume is the oldest indicator in technical analysis and remains one of the most reliable. It measures the number of shares traded at each price bar — a direct gauge of participant conviction. Price moving up on increasing volume reflects genuine buying pressure. Price moving up on declining volume is losing participation — a warning that the move may not sustain.
The volume confirmation rule: only take breakouts and breakdowns accompanied by above-average volume. A 5-minute chart breakout to a new high on two times average volume is a valid setup. The same breakout on half-average volume is a candidate for a fade — the ‘thin air breakout’ that fails within minutes.
Relative Volume (RVOL): Finding Exceptional Setups
RVOL compares today’s volume to the historical average volume at the same time of day. An RVOL of 2.0 means the stock is trading at twice its normal volume for this time of day. RVOL above 1.5 to 2.0 is the standard threshold for day trading scanners — it identifies stocks where participation is unusually high, creating the conditions for larger-than-normal directional moves.
Stocks trading at 5x or 10x normal volume are in play — they have the participation and volatility that day trading requires. Stocks with RVOL below 0.5 are dead money for intraday traders regardless of their technical setup.
Volume Dry-Up Before Breakout
One of the most reliable intraday volume patterns: volume contracts significantly during a consolidation before a breakout (often the NR7 pattern or a tight sideways range with declining bars), then expands sharply on the break. This volume dry-up signals diminishing selling pressure — as sellers exhaust themselves in the consolidation, the eventual breakout finds less resistance and more conviction.
Indicator 6: ATR — Setting Stops and Sizing Positions
| What It Answers
ATR answers the risk question: how much room does this stock need before my stop is genuinely wrong? Setting stops based on ATR prevents the most common day trading mistake — stops placed too tight that are triggered by normal volatility before the trade can develop. |
Average True Range measures the average price range of each bar over a specified period, adjusted for gaps. On a 5-minute chart with 14-period ATR, it measures the average 5-minute bar range over the last 14 bars — a real-time measure of intraday volatility.
ATR-Based Stop Placement
The standard ATR stop approach: set stops 1.0x to 1.5x ATR below your entry for long trades. For a stock with a 5-minute ATR of $0.60, a 1.0x ATR stop means the stop is $0.60 below entry — outside the normal noise of the intraday bar range.
The critical insight: a stock with a $0.60 five-minute ATR will routinely move $0.20-$0.40 in a single bar without any change in trend direction. Setting a $0.20 stop on such a stock is not risk management — it is near-guaranteed stop-out from normal volatility before the trade develops. ATR calibrates the stop to the stock’s actual price behaviour.
ATR and Position Sizing
The ATR stop calculation connects directly to position sizing. If your maximum risk per trade is $200 and your ATR-based stop requires a $0.60 move, your maximum position size is approximately 333 shares ($200 ÷ $0.60). This creates a mathematically precise, volatility-adjusted position size — a direct application of ATR to capital management.
Daily ATR for Target Setting
Knowing a stock’s average daily range helps set realistic profit targets. If a stock typically moves $2.00 intraday and has already moved $1.80 by 11 AM, the remaining expected range is limited. Chasing a late entry on a stock that has already travelled 90% of its average daily range dramatically reduces the probability of capturing meaningful additional movement.
Indicator 7: Market Internals — The Context Layer Most Day Traders Ignore
| What It Answers
Market internals answer the context question: is the broader market environment supporting my trade direction? A perfect individual stock setup in a hostile market environment has significantly lower probability of success than the same setup in a supportive market environment. |
Market internals are real-time readings of broad NYSE market participation — not individual stock indicators. They tell you what the majority of stocks are doing right now, not just the one you are watching. Most professional day traders monitor at least one internal continuously during the trading session.
Note: market internals require a trading platform with real-time data feeds. They are available on ThinkorSwim, TradingView (with NYSE data subscription), TradeStation, and most professional platforms — not on basic free charting tools.
NYSE TICK ($TICK)
TICK counts the number of NYSE stocks printing on an uptick minus those on a downtick at any moment. Readings above +800 signal broad, synchronised buying pressure across NYSE stocks. Readings below -800 signal broad selling.
Practical application: only take long setups when TICK is neutral to positive (+200 or above). Avoid new long entries when TICK is deeply negative (-600 or below) regardless of how strong the individual stock setup looks. The stock is fighting the broad market tape — a losing battle in most cases.
Advance-Decline (ADD or $ADD)
ADD counts the number of advancing NYSE stocks minus declining stocks in real time. A strongly positive ADD (+500 or higher) confirms that the bullish environment extends beyond a handful of large-cap leaders. A deeply negative ADD (-500 or below) means the market is broadly declining — individual long setups are fighting the tide.
TRIN (Arms Index)
TRIN (Trader’s Index) is a volume-weighted breadth indicator. TRIN below 0.80 signals bullish conditions — more volume is flowing to advancing stocks. Above 1.20 signals selling pressure. Extreme readings (below 0.50 or above 2.0) suggest potential reversal or exhaustion of the current directional move.
How to Use Internals: As a Filter, Not an Entry Signal
Internals do not generate individual trade entries. They filter whether existing setups should be taken and at what confidence level. A strong individual stock setup with TICK at +800 and ADD positive is a high-confidence trade. The identical setup with TICK at -900 and ADD deeply negative is a pass, or at minimum a significantly reduced position size.
Combining the 7 Indicators: A Layered Day Trading System
The value of these seven indicators comes from their combination — each layer answering a specific question in a defined sequence before a trade is taken:
| Indicator | Question Answered | Key Setting | How to Apply |
|---|---|---|---|
| Market Internals | Context | TICK / ADD / TRIN | Filter — pass on setups fighting the tape |
| VWAP | Intraday bias | Session VWAP + 2 SD bands | Only long above VWAP; short below |
| 9 + 20 EMA | Short-term trend | 9 EMA, 20 EMA on 5-min | 9 above 20 = bullish; entries at EMA pullbacks |
| MACD | Momentum | 3/10/16 or 5/13/1 intraday | Histogram expanding = conviction; shrinking = warning |
| Volume / RVOL | Move confirmation | RVOL threshold: 1.5-2.0x | Only take breakouts on above-average volume |
| ATR | Stop and size | 14-period, 5-min chart | Stop = 1.0-1.5x ATR; size = risk ÷ ATR stop |
| Price Action | Entry trigger | Raw bars, no calculation | Pattern + indicator alignment = entry |
A day trade with maximum conviction needs all seven layers aligned: internals supportive, price above VWAP, 9 EMA above 20 EMA, MACD expanding in the direction of the trade, volume confirming the breakout, ATR-based stop in place, and a clear price action trigger. When three or four layers are aligned rather than all seven, position size accordingly.
Most importantly: the system only works if you follow it. Overriding indicators because a trade ‘feels right’ — taking a long when TICK is deeply negative, entering without volume confirmation, ignoring the MACD divergence — turns a systematic edge into random guessing.
| Learn the Complete Rules-Based Day Trading System With ATGL
At AboveTheGreenLine.com we give active traders the complete framework — not just the indicators, but the rules for when each fires, how they confirm each other, how to size positions, and how to manage exits systematically. Join us Above the Green Line and get the full system with live application. |
Frequently Asked Questions
What is the most accurate indicator for day trading?
No single indicator is universally the most accurate — accuracy comes from how indicators are combined to confirm each other. VWAP is the closest to a universally referenced intraday level, used by institutions and retail traders alike. Among momentum indicators, MACD is widely cited for identifying trend and momentum shifts. The most effective day trading systems use multiple indicators answering different questions rather than relying on any single indicator for all decisions.
Is VWAP good for day trading?
VWAP is the single most important intraday reference level for most day traders. It represents the average price weighted by volume for that session — a fair value benchmark that institutional traders also use. Price above VWAP signals bullish intraday bias; below signals bearish. Strong stocks reclaim VWAP after dips; weak stocks fail to reclaim it. VWAP resets each session and applies only to intraday charts — it is a day trading-specific tool.
How many indicators should a day trader use?
Most experienced day traders use 2-4 indicators maximum on their primary chart, chosen to answer different trading questions without redundancy. Adding multiple indicators that measure the same thing — RSI, MACD, and Stochastic are all momentum oscillators — creates confirmation bias without adding genuine signal. The goal is a small set of non-redundant indicators that together cover context, bias, trend, momentum, confirmation, and risk.
What is the best EMA for day trading?
The 9-period and 20-period EMAs are the most widely used exponential moving averages for intraday day trading. The 9 EMA is the fastest short-term momentum signal — price holding above it indicates strong momentum; a cross below is the first warning of fading momentum. The 20 EMA acts as a slightly slower support/resistance level. When the 9 EMA is above the 20 EMA and both are rising, the trend is bullish and pullbacks to these levels are potential entries.

Related Articles
[pt_view id=”9b64b383ox”]