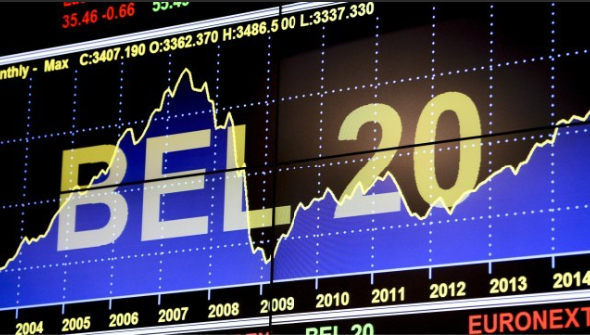
The BEL 20 is the benchmark stock market index for Euronext Brussels, representing the performance of the largest and most liquid companies listed in Belgium. It reflects the economic health of Belgium’s stock market, providing a snapshot of its financial landscape and offering valuable insights to both domestic and global investors.
What is the BEL 20?
The BEL 20 is a capitalization-weighted index that consists of 20 Belgian companies, representing various sectors such as financials, pharmaceuticals, telecommunications, and consumer goods. The weight of each company in the index is based on its market capitalization, meaning larger companies exert more influence over the index’s movements. Major components of the BEL 20 include companies like KBC Group (financials), Anheuser-Busch InBev (consumer goods), and Solvay (chemicals).
Why is the BEL 20 Important?
Economic Barometer for Belgium: The BEL 20 is considered a key indicator of the Belgian economy. As Belgium is part of the European Union and the Eurozone, the index also provides insights into the performance of the European market as a whole.
Representation of Key Sectors: Belgium’s economy is diverse, with strengths in banking, consumer goods, chemicals, and pharmaceuticals. The BEL 20 gives investors exposure to these sectors, which are influenced by both domestic and global economic trends.
Regional and Global Significance: While the index reflects the Belgian economy, many of its constituent companies have significant international operations. For example, AB InBev is one of the world’s largest beverage companies, and Solvay is a global leader in advanced materials and chemicals.
Investor Benchmark: The BEL 20 is a key benchmark for institutional investors who focus on the Belgian or broader European markets. Its performance is tracked by various funds, making it a valuable reference point for portfolio performance.
Why Should You Use It?
Exposure to Leading Belgian Companies: By tracking or investing in the BEL 20, you gain exposure to Belgium’s top-performing companies, many of which operate internationally, offering a balance of local and global market trends.
Diversification: The BEL 20 covers various sectors, including finance, consumer goods, healthcare, and materials, providing diversified exposure within the Belgian market. This can be useful for investors looking to balance risk while gaining access to multiple industries.
Stability in European Markets: Belgium’s economy tends to be stable compared to other European markets, which can make the BEL 20 an attractive option for investors looking for relatively moderate risk with exposure to the Eurozone.
Tracking European Market Trends: Because Belgium is closely tied to broader European economic developments, tracking the BEL 20 can help investors stay informed about trends that may affect other Eurozone investments.
Should You Invest in It?
Investing in the BEL 20 can be a good opportunity for several types of investors, but there are considerations to weigh:
Growth Opportunities: Many companies within the BEL 20 are global leaders in their sectors, providing opportunities for growth, especially in consumer goods, chemicals, and pharmaceuticals. With the European economy in gradual recovery, these companies may benefit from stronger demand both locally and internationally.
Moderate Risk: The index is relatively stable compared to other European markets, but it is still influenced by global economic conditions. Factors like trade relations, Eurozone policies, and geopolitical risks can impact performance.
Dividend Potential: Some BEL 20 companies are known for offering attractive dividends, which can be appealing for income-focused investors. Stable companies like KBC Group and AB InBev have a history of distributing dividends, providing steady returns for long-term investors.
Currency Risk: For investors outside the Eurozone, exchange rate fluctuations between the euro and other currencies could affect the returns. It’s important to consider this when evaluating potential profits or losses.
Conclusion
The BEL 20 offers investors exposure to Belgium’s top 20 companies across a range of sectors, with significant opportunities in finance, consumer goods, and healthcare. It serves as an important barometer for Belgium’s economy and can be a useful tool for tracking broader European market trends. While investing in the BEL 20 provides diversification and access to dividend-paying companies, potential risks such as market volatility and currency fluctuations should be considered. For investors seeking a mix of stability and growth in the European market, the BEL 20 is an index worth considering.
Above The Green Line’s systematic approach has completely transformed my trading. I’ve gone from inconsistent results to reliable gains, even during market downturns.”
John D.
Member Since 2019
The systematic approach has been a game-changer for my portfolio. I no longer second-guess my trading decisions and have seen consistent returns even in volatile markets.”
Sarah K.
Retired Financial Advisor
I’ve tried several trading services, but Above The Green Line stands out for its clear signals and educational approach. My annual returns have improved by over 20% since joining.”
Michael R.
Engineer & Part-time Trader
The community aspect is invaluable. Being able to learn from experienced traders and discuss strategies in real-time has accelerated my trading knowledge tremendously.