Sep 7, 2025.
The Top Pick of the Week System is up +61.7 % compounded, vs the S&P 500 up +13.6% (since the Oct. 7, 2024 inception).
For busy investors that don’t have time to Swing Trade, we now have a simple Strategy:
Top Pick of the Week. You Buy the “Pick” on Monday morning, and then Sell on Friday’s Close. It’s a time-efficient approach designed to capture short-term gains without requiring constant market monitoring.
This “Pick” is emailed to you with this Weekly Commentary (see below & more details here).
The Top Pick of the Week is: MicroStrategy Inc. $MSTR to be bought on the Open on Monday, and will be sold on the Close on Friday.
You can view the current Weekly Stock Performance.
______________________________________________________________________________
DAILY SWING TRADING (SHORT TERM)Watch List and Charts to Buy Soon.
| Daily Swing Watch List to Buy | Daily Swing Charts to Buy |
| Current Daily Swing Positions | Current Swing Charts |
| Closed Daily Swing Results | Trading Dashboard |
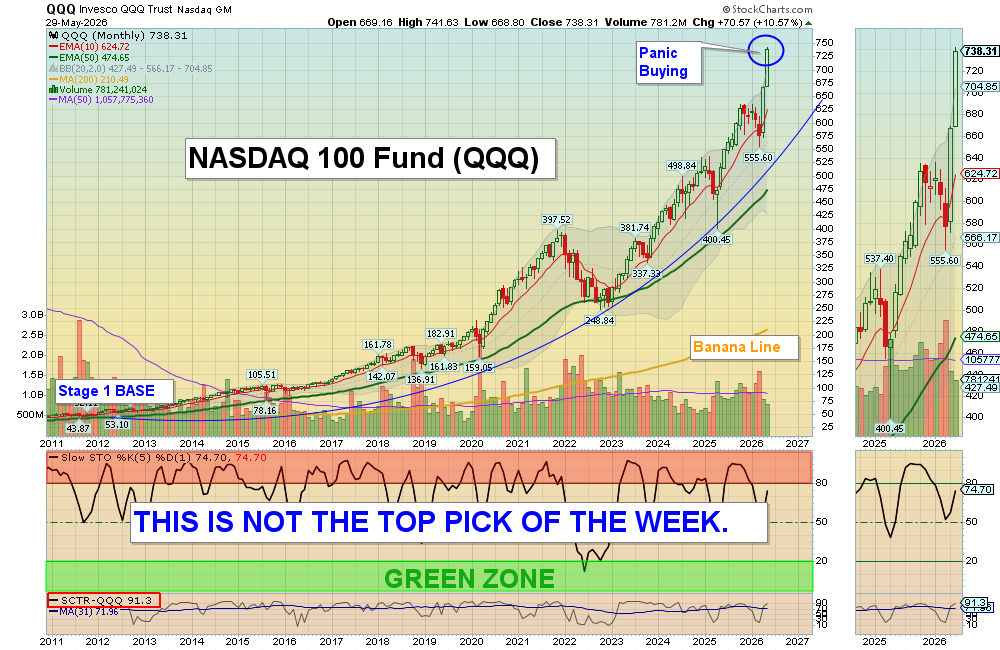
9/07/2025 Markets were mixed again for the week, and only the S&P 500 & DOW 30 Indices were able to make slightly higher highs this time up. The NASDAQ 100 & Semiconductor Funds bounced up off the Red Lines (50-day avgs.) but did not have much power.
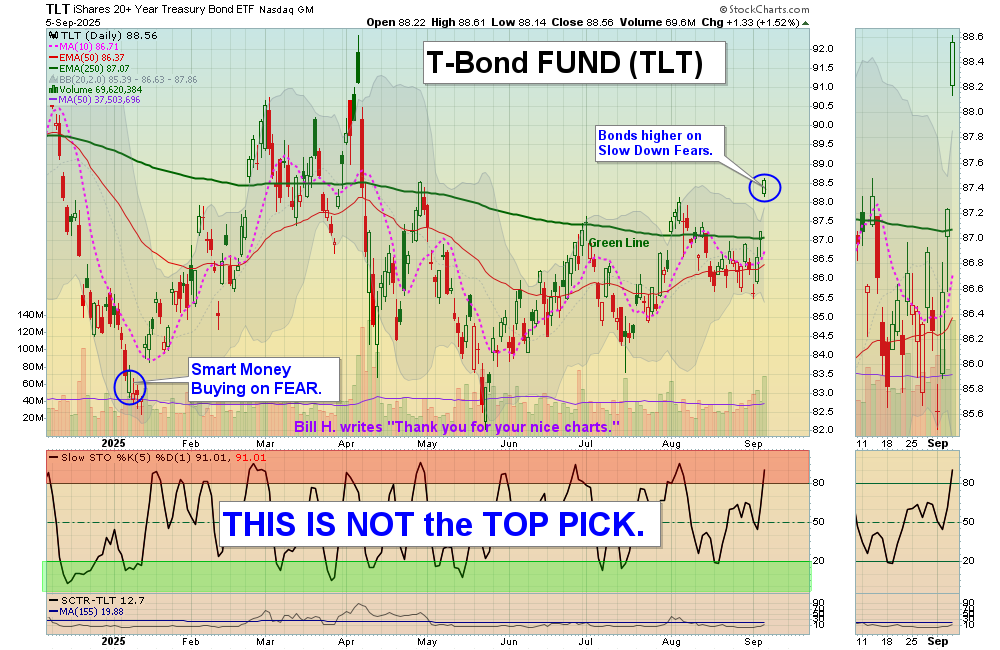
“Buy the Dip” investors could be running out of money for a while, as they had to get Fully Invested on this 4 month Buying Stampede. The Strongest Stocks and Indices are still overbought now after the April Fear Flush down. Smart Money has been Raising Cash to be able to Buy these Leaders on the next pull-back. Gold Miners made new highs, and Bonds were much higher on Jobs weakness…
We Buy the strongest Leaders that make new highs, on pull-backs. So follow the Green Line System and you should continue to win more than you lose. SEE WATCH LIST
With the Green Line System, your Money should flow into the Strongest areas and your Account value should be able to grow in both Bull and Bear Markets. Follow the MONEY, not the MEDIA.
______________________________________________________________________________
For the week the Dow was down 0.24%, the S&P 500 was up 0.33% and the NASDAQ 100 was up 0.99%. The major Indices still have a Relative Strength below 80, so you should currently own the stronger Funds here.
The Inflation Index (CRB) was down 1.51% this week and is Above the Green Line, indicating Economic Expansion.
Bonds were up 2.65% for the week, and are Above the Green Line, indicating Economic Contraction.
The US DOLLAR was down 0.03% for the week.
Crude Oil was down 3.19% for the week at $61.97 and GOLD was up 3.99% at $3587.50.
_______________________________________________________________________
DAY TRADERS: We are doing many profitable Day Trades at our Live Trading Room on YouTube during Market hours. Please join Discord or X (Twitter) with your cell phone app for the fastest Trade Alerts and Daily email notifications during the day. Other methods of notification have been too slow.
_______________________________________________________________________
SWING TRADE COMPLETED TRADES:
AMPX & TMC Slipped down to the Buy Price and were Stopped Out even.
We are now in 4 Three Star logged Swing Trading Positions for the Short Term. There are only 2 investments on the Short Term Watch List.
Completed Swing Trades thru Aug 2025: 164 Trades, + 422% Total. Avg. Trade = 2.58 % Gain (before taxes and commissions).
______________________________________________________________________________
WEEKLY SWING (GREEN ZONE POPS) WATCH LIST
Watchlist is for Members Only
There are currently <strong>8</strong> investments on deck to be purchased, based on our Daily Swing Trading strategy.
| ✅ Every stock currently on deck | ✅ Real-time SCTR and price data |
| ✅ Daily % change tracking | ✅ Entry criteria and comments for each pick |
|
Already a Member? 🔒 LOG IN → |
Not a Member Yet? VIEW MEMBERSHIP PLANS → |
Current Watchlist (Preview)
Become a member to see exactly which stocks are on deck and why.
| Open Date | Symbol | Description | SCTR | Last Price | Daily Change % | Comments |
|---|---|---|---|---|---|---|
| 🔒 | 🔒 | 🔒 | 🔒 | 🔒 | 🔒 | Members Only |
| 🔒 | 🔒 | 🔒 | 🔒 | 🔒 | 🔒 | Members Only |
| 🔒 | 🔒 | 🔒 | 🔒 | 🔒 | 🔒 | Members Only |
| 🔒 | 🔒 | 🔒 | 🔒 | 🔒 | 🔒 | Members Only |
| 🔒 | 🔒 | 🔒 | 🔒 | 🔒 | 🔒 | Members Only |
| 🔒 | 🔒 | 🔒 | 🔒 | 🔒 | 🔒 | Members Only |
| 🔒 | 🔒 | 🔒 | 🔒 | 🔒 | 🔒 | Members Only |
| 🔒 | 🔒 | 🔒 | 🔒 | 🔒 | 🔒 | Members Only |
⭐ Join today to see our full watchlist and get alerted the moment we buy.
BECOME A MEMBER →Past performance is not indicative of future results.
Weekly Green Zone Pops- Click here for scrolling charts.
WEEKLY SWING (GREEN ZONE POP) TRADES
SMR NuScale Power Weekly Green Zone Buy. Target $47.00.
TMC The Metals Company Weekly Green Zone Buy. Target $7.50.
POET POET Tech. Was Stopped Out with a 1.31 % Loss.
Completed Weekly Swing Trades thru Aug 2025: 24 Trades, +494% Total, or 20.6 % / Trade (before taxes & commissions).
______________________________________________________________________________
Important Links| Top 100 | Stage Chart Investing | CNN Fear & Greed Index |
| Dividend Growth Portfolio | ETF Sector Portfolio | Dogs of the Dow |
| Long Term Strategy | Stage Chart Investing | Articles |
Alert! Market Risk is Medium (Yellow). The probability of successful Short Term Trades is better, when the % of stocks above the 50-day avg. is below 20.
Tell your Friends about the Green Line, and Help Animals.
______________________________________________________________________________
QUESTION: Kerry writes:
“I am a relatively new member and am curious about the rationale for one of the rules. As I understand it, to qualify as a buy, a security must close below the the Money Wave (slow stochastic) reading of 20 for at least one day; merely dipping below the 20 reading for a part of the day and then breaking out above it that same day is insufficient to qualify for a buy. I am curious about the rationale for that distinction.
Thanks so much in advance,”
ANSWER:
Sometimes the Strongest Investments do not Close on the Green Zone, and take off again. But we need to follow firm Rules to have a System, so we require a Close in the Green Zone.
If many Investments are coming down in the Green Zone together on a Market drop, it is fine to fudge on the Rule (and sometimes better) and Buy the ones that only “Tag & Go” down the 20 Zone.
Just have a Sell Stop Loss Below the trade.
Good trading, and tell your friends!