Sep 21, 2025.
The Top Pick of the Week System is up +66 % compounded, vs the S&P 500 up +16% (since the Oct. 7, 2024 inception).
For busy investors that don’t have time to Swing Trade, we now have a simple Strategy:
Top Pick of the Week. You Buy the “Pick” on Monday morning, and then Sell on Friday’s Close. It’s a time-efficient approach designed to capture short-term gains without requiring constant market monitoring.
This “Pick” is emailed to you with this Weekly Commentary (see below & more details here).
The Top Pick of the Week is: Futu Holdings Ltd. $FUTU to be bought on the Open on Monday, and will be sold on the Close on Friday.
You can view the current Weekly Stock Performance.
______________________________________________________________________________
DAILY SWING TRADING (SHORT TERM)Watch List and Charts to Buy Soon.
| Daily Swing Watch List to Buy | Daily Swing Charts to Buy |
| Current Daily Swing Positions | Current Swing Charts |
| Closed Daily Swing Results | Trading Dashboard |
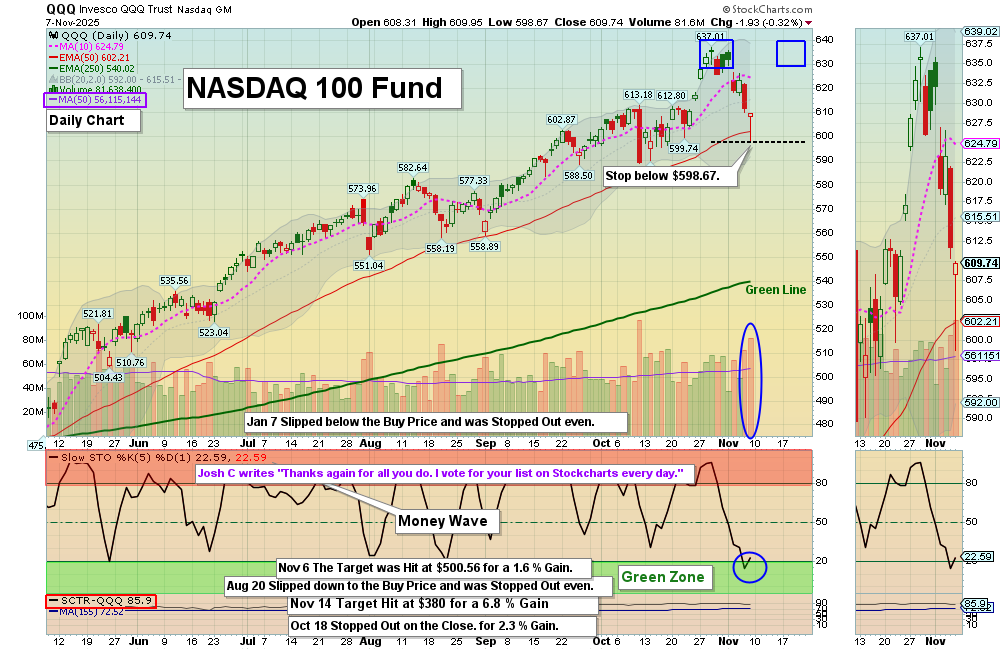
9/21/2025 Markets were up again for the week as the Strongest Leaders squirted up on Buying and a Short Squeeze. The S&P 500, DOW 30, Small Caps, & NASDAQ 100 Indices were able to make higher highs again with limited selling.
Investors are Buying after the FED Cut short term Interest Rates on Wednesday, as lower Rates adds liquidity to Stocks and the Economy. But these is normally a Cost for lower Rates, as Inflation could pick up again.
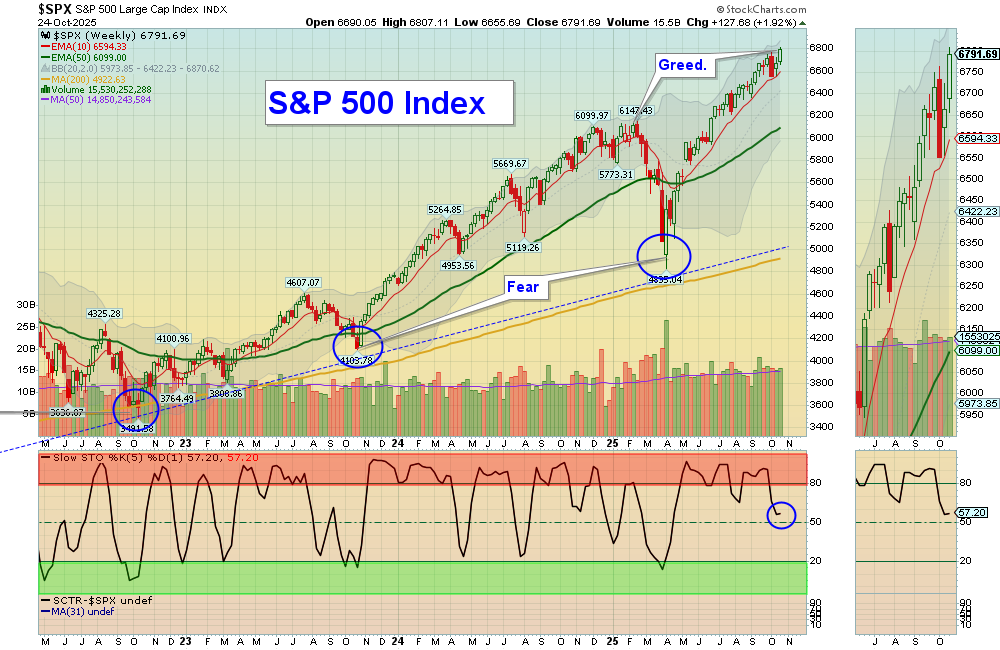
The Strongest Stocks and Indices are very overbought now after the April Fear Flush down. Smart Money has been Raising Cash to be able to Buy these Leaders on the next pull-back. The Indices will meet again with the Green Lines (much lower). Gold Miners made new highs, and Bonds were lower on FED Printing Fears.
We Buy the strongest Leaders that make new highs, on pull-backs. So follow the Green Line System and you should continue to win more than you lose. SEE WATCH LIST
With the Green Line System, your Money should flow into the Strongest areas and your Account value should be able to grow in both Bull and Bear Markets. Follow the MONEY, not the MEDIA.
______________________________________________________________________________
For the week the Dow was up 1.08%, the S&P 500 was up 1.24% and the NASDAQ 100 was up 2.16%. The major Indices still have a Relative Strength below 80, so you should currently own the stronger Funds here.
The Inflation Index (CRB) was down 0.90% this week and is Above the Green Line, indicating Economic Expansion.
Bonds were down 1.03% for the week, and are Above the Green Line, indicating Economic Contraction.
The US DOLLAR was up 0.12% for the week.
Crude Oil was up 0.25% for the week at $62.72 and GOLD was up 1.10% at $3682.50.
_______________________________________________________________________
DAY TRADERS: We are doing many profitable Day Trades at our Live Trading Room on YouTube during Market hours. Please join Discord or X (Twitter) with your cell phone app for the fastest Trade Alerts and Daily email notifications during the day. Other methods of notification have been too slow.
_______________________________________________________________________
SWING TRADE COMPLETED TRADES:
MP MP Material Target was Hit at $74 with a 17.4% Gain.
PLTR Palantir Tech Target was Hit at $180 with a 15.3% Gain.
SMR NuScale Power Sold at $40 via Trade Alert with a 10 % Gain.
We are now in 2 Three Star logged Swing Trading Positions for the Short Term. There is only 1 investment on the Short Term Watch List.
Completed Swing Trades thru Aug 2025: 164 Trades, + 422% Total. Avg. Trade = 2.58 % Gain (before taxes and commissions).
______________________________________________________________________________
WEEKLY SWING (GREEN ZONE POPS) WATCH LIST
Watchlist is for Members Only
There are currently <strong>7</strong> investments on deck to be purchased, based on our Daily Swing Trading strategy.
| ✅ Every stock currently on deck | ✅ Real-time SCTR and price data |
| ✅ Daily % change tracking | ✅ Entry criteria and comments for each pick |
|
Already a Member? 🔒 LOG IN → |
Not a Member Yet? VIEW MEMBERSHIP PLANS → |
Current Watchlist (Preview)
Become a member to see exactly which stocks are on deck and why.
| Open Date | Symbol | Description | SCTR | Last Price | Daily Change % | Comments |
|---|---|---|---|---|---|---|
| 🔒 | 🔒 | 🔒 | 🔒 | 🔒 | 🔒 | Members Only |
| 🔒 | 🔒 | 🔒 | 🔒 | 🔒 | 🔒 | Members Only |
| 🔒 | 🔒 | 🔒 | 🔒 | 🔒 | 🔒 | Members Only |
| 🔒 | 🔒 | 🔒 | 🔒 | 🔒 | 🔒 | Members Only |
| 🔒 | 🔒 | 🔒 | 🔒 | 🔒 | 🔒 | Members Only |
| 🔒 | 🔒 | 🔒 | 🔒 | 🔒 | 🔒 | Members Only |
| 🔒 | 🔒 | 🔒 | 🔒 | 🔒 | 🔒 | Members Only |
⭐ Join today to see our full watchlist and get alerted the moment we buy.
BECOME A MEMBER →Past performance is not indicative of future results.
Weekly Green Zone Pops- Click here for scrolling charts.
WEEKLY SWING (GREEN ZONE POP) TRADES
BUYS
ACHR Archer Aviation Weekly Swing Trade Pop was good for 12.7 %. Target is $12.25.
BBAI BigBear AI Weekly Swing Trade Pop was good for 35 %. AVOID.
JOBY Joby Aviation Weekly Swing Trade Pop was good for 18.6%. Target $18.
SELLS
CRWD CrowdStrike Holdings Target was Hit at $490 with a 10.9% Gain.
SMR NuScale Power Target was Hit at $47 with a 36.1% Gain.
TSLA Tesla Inc. Stopped Out with an – 8 % Loss.
Completed Weekly Swing Trades thru Aug 2025: 24 Trades, +494% Total, or 20.6 % / Trade (before taxes & commissions).
______________________________________________________________________________
Important Links| Top 100 | Stage Chart Investing | CNN Fear & Greed Index |
| Dividend Growth Portfolio | ETF Sector Portfolio | Dogs of the Dow |
| Long Term Strategy | Stage Chart Investing | Articles |
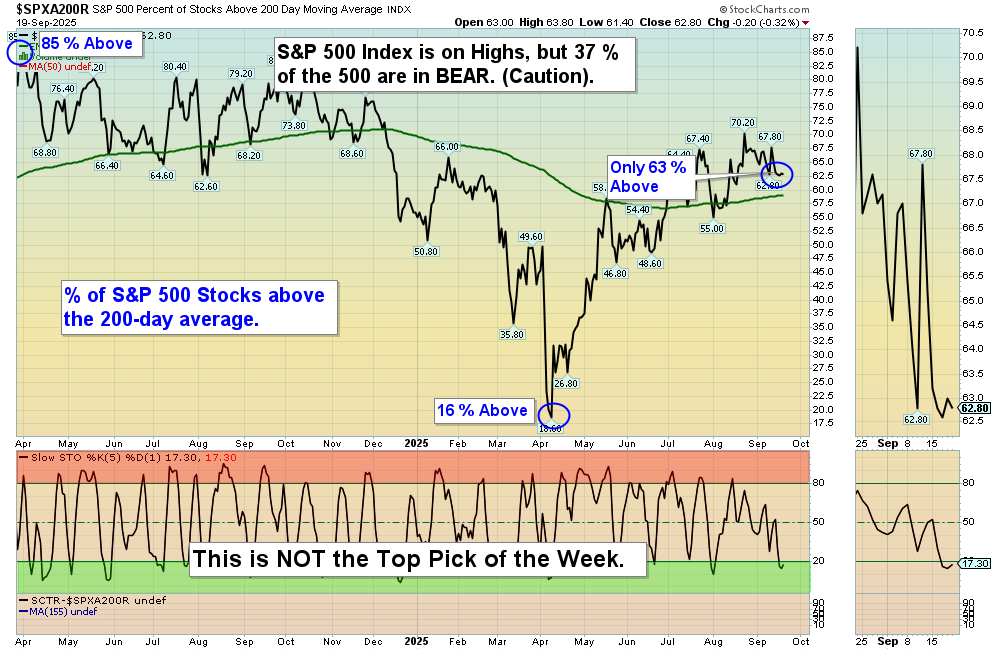
Alert! Market Risk is Medium (Yellow). The probability of successful Short Term Trades is better, when the % of stocks above the 50-day avg. is below 20.
Tell your Friends about the Green Line, and Help Animals.
______________________________________________________________________________
QUESTION: Jackie writes “Been reading your informative articles and FAQs. Is there a way I can enter a stock such as BA or an ETF symbols and see them shown as ATGL chart with red/green zones, MAs, sector ranking, Green Line etc?”
ANSWER: Yes. Near the bottom of each Daily email, look for: ARE YOUR INVESTMENTS ABOVE THE GREEN LINE?
Please Click on the link (To make the Chart larger, please change the SIZE to Landscape and then Update.)
Good trading and tell your friends!