Jun 15, 2025.
For busy investors that don’t have time to Swing Trade, we now have a simple Strategy:
Top Pick of the Week. You Buy the “Pick” on Monday morning, and then Sell on Friday’s Close. It’s a time-efficient approach designed to capture short-term gains without requiring constant market monitoring.
This “Pick” is emailed to you with this Weekly Commentary (see below & more details here).
The Top Pick of the Week is: Chewy Inc. CHWY will be bought on the Open on Monday, and will be Sold on the Close this Friday.
The 30 Top Picks of the Week Trades are up 30.76 %, and the S&P 500 Fund (SPY) is up +4.5 %.
You can view the current Weekly Stock Performance.
______________________________________________________________________________
DAILY SWING TRADING (SHORT TERM)Watch List and Charts to Buy Soon.
| Daily Swing Watch List to Buy | Daily Swing Charts to Buy |
| Current Daily Swing Positions | Current Swing Charts |
| Closed Daily Swing Results | Trading Dashboard |
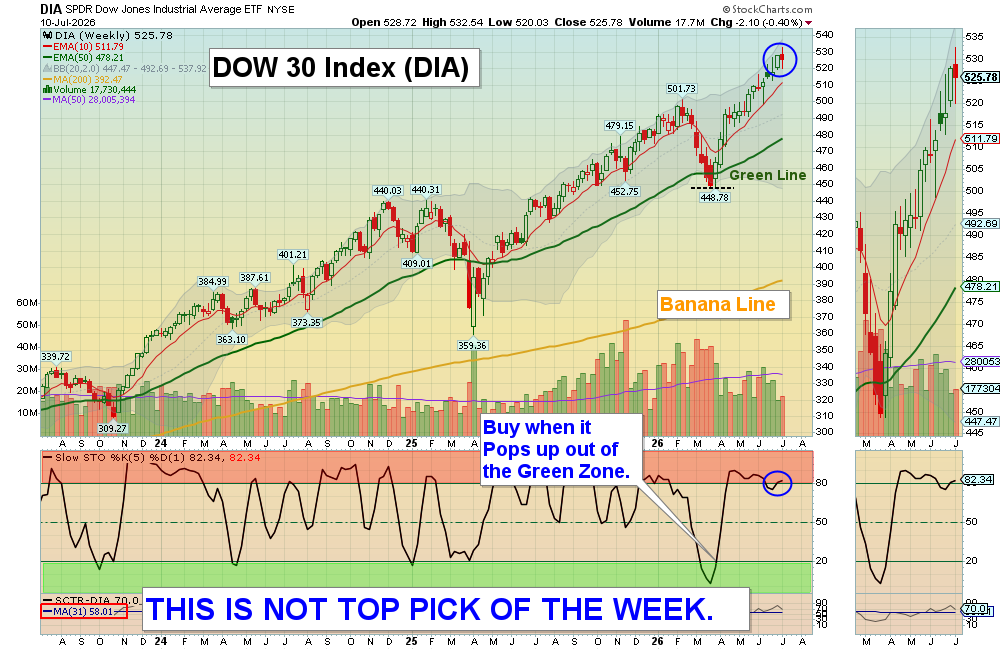
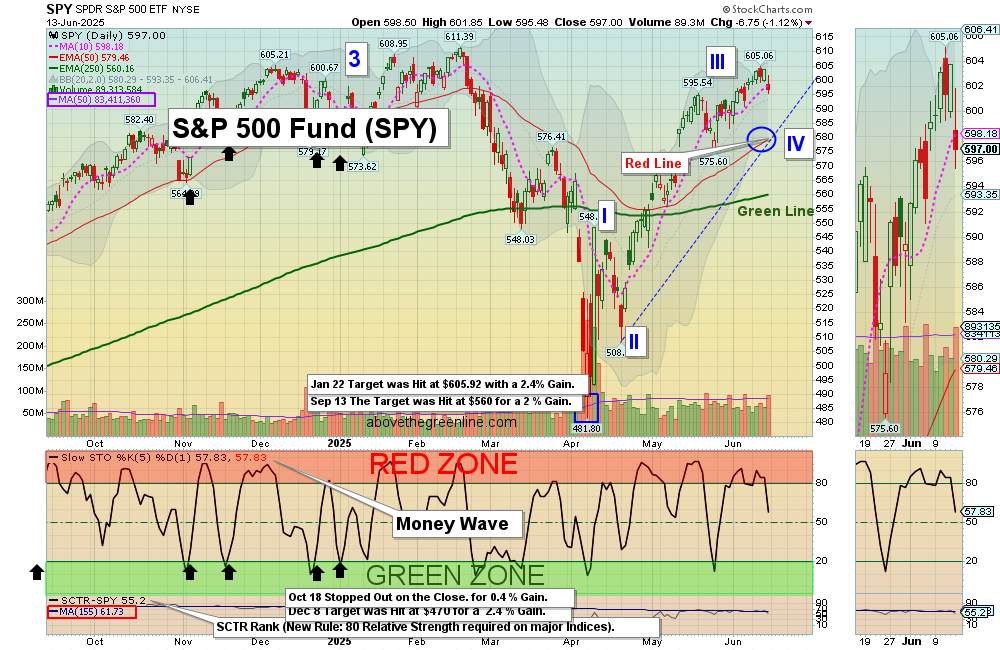
6/15/2025 Markets were down for the week, as the Indices got up near the February highs (Resistance). We should find out in a few weeks if the Indices can make higher highs, or Double Top (Bearish). The S&P 500 could be correcting down near the Red Line (50-day avg.) which is normal after a big run up near old Resistance (Sellers) in the chart above.
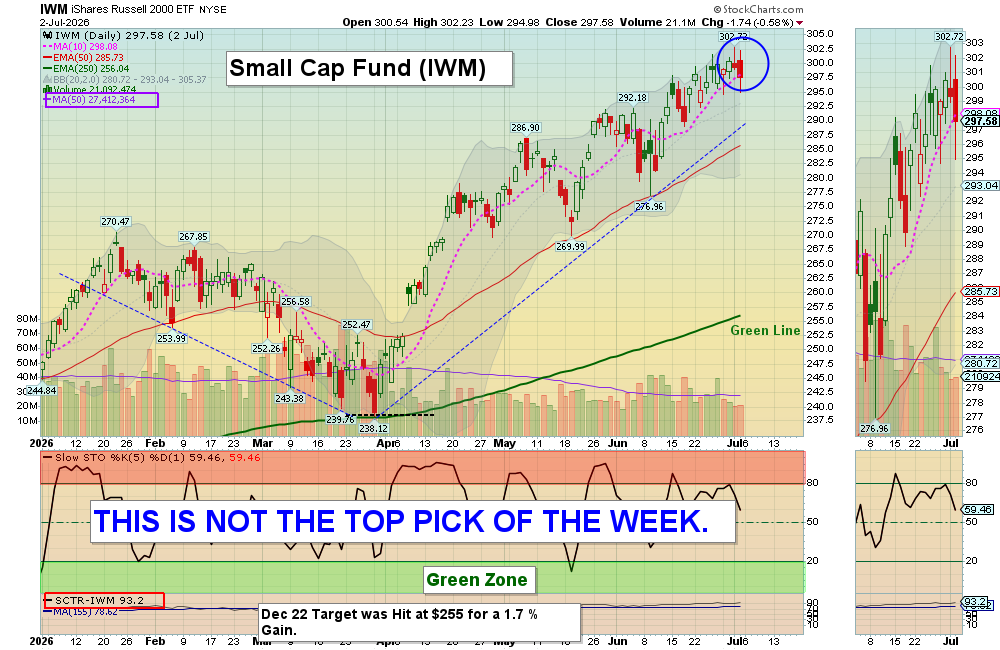
Gold and Gold Miners are still strong on Economic uncertainty. Bit-Coin is struggling after not staying above the recent new highs. The Small Caps are struggling with the high long term Interest Rates. Please be patient. This current weakness on long term Bonds should be a correction here, and then back up.
We Buy the strongest Leaders that make new highs, on pull-backs. So follow the Green Line System and you should continue to win more than you lose. SEE WATCH LIST
With the Green Line System, your Money should flow into the Strongest areas and your Account value should be able to grow in both Bull and Bear Markets. Follow the MONEY, not the MEDIA.
______________________________________________________________________________
For the week the Dow was down 1.30%, the S&P 500 was down 0.36% and the NASDAQ 100 was down 0.56%. The major Indices still have a Relative Strength below 80, so you should currently own the stronger Funds here.
The Inflation Index (CRB) was up 2.99% this week and is Above the Green Line, indicating Economic Expansion.
Bonds were up 1.15% for the week, and are Below the Green Line, indicating Economic Expansion.
The US DOLLAR was down 1.01% for the week.
Crude Oil was up 13.32% for the week at $73.18 and GOLD was up 3.63 % at $3432.03.
_______________________________________________________________________
DAY TRADERS: We are doing many profitable Day Trades on our Discord Trading Hub (free). Please join Discord or X (Twitter) with your cell phone app for the fastest Trade Alerts and Daily email notifications during the day. Other methods of notification have been too slow. Also, please check our our Live Trading Room on YouTube during Market hours.
_______________________________________________________________________
SWING TRADE COMPLETED TRADES:
OKLO Oklo Inc. Target was Hit at $56 with an 11.4% Gain.
RGTI Rigetti Computing Sold via email for a 15.9 % Gain.
HIMS & IONQ Stopped Out even (Don’t Take a Loss!).
IBIT Bit-Coin Fund Stopped Out with a 1.29 % Loss.
We are now in 3 Three Star logged Swing Trading Positions for the Short Term. There are 3 investments on the Short Term Watch List.
Completed Swing Trades thru May 2025: 95 Trades, + 253.3% Total. Avg. Trade = 2.67 % Gain (before taxes and commissions).
______________________________________________________________________________
LONG TERM WATCH LIST
Watchlist is for Members Only
There are currently <strong>5</strong> investments on deck to be purchased, based on our Daily Swing Trading strategy.
| ✅ Every stock currently on deck | ✅ Real-time SCTR and price data |
| ✅ Daily % change tracking | ✅ Entry criteria and comments for each pick |
|
Already a Member? 🔒 LOG IN → |
Not a Member Yet? VIEW MEMBERSHIP PLANS → |
Current Watchlist (Preview)
Become a member to see exactly which stocks are on deck and why.
| Open Date | Symbol | Description | SCTR | Last Price | Daily Change % | Comments |
|---|---|---|---|---|---|---|
| 🔒 | 🔒 | 🔒 | 🔒 | 🔒 | 🔒 | Members Only |
| 🔒 | 🔒 | 🔒 | 🔒 | 🔒 | 🔒 | Members Only |
| 🔒 | 🔒 | 🔒 | 🔒 | 🔒 | 🔒 | Members Only |
| 🔒 | 🔒 | 🔒 | 🔒 | 🔒 | 🔒 | Members Only |
| 🔒 | 🔒 | 🔒 | 🔒 | 🔒 | 🔒 | Members Only |
⭐ Join today to see our full watchlist and get alerted the moment we buy.
BECOME A MEMBER →Past performance is not indicative of future results.
ATGL Long Term Weekly Watchlist- Click here for scrolling charts.
Completed Long Term Trades in 2024: 51 Trades, +333.46% Total, or 9.6 % / Trade (before taxes & commissions).
______________________________________________________________________________
Important Links| Top 100 | Stage Chart Investing | CNN Fear & Greed Index |
| Dividend Growth Portfolio | ETF Sector Portfolio | Dogs of the Dow |
| Long Term Strategy | Stage Chart Investing | Articles |
Alert! Market Risk is Medium (YELLOW). The probability of successful Short Term Trades is better, when the % of stocks above the 50-day avg. is below 20.
Tell your Friends about the Green Line, and Help Animals.
______________________________________________________________________________
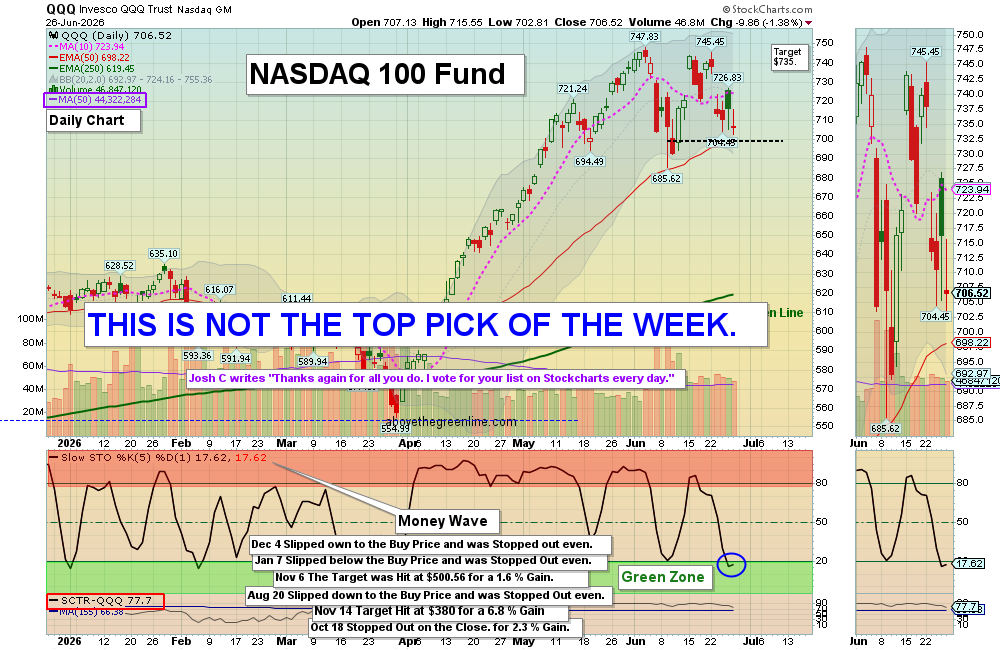
QUESTION: Jose M writes “Morning, I seem to have difficulties on finding the Money Wave chart on the ETFs. Thanks.”
ANSWER: First go to MY TRADING DASH BOARD. Then the Charts with the Money Waves can be pulled up by clicking on the Symbol of the Investment on the Watch List or Current Positions links in every Daily email.
The Money Wave is the Red and Green Zone on the bottom part of the Chart. Buy when the Money Wave has gone down into the Green Zone, and then turns up above 20.