Aug 10, 2025.
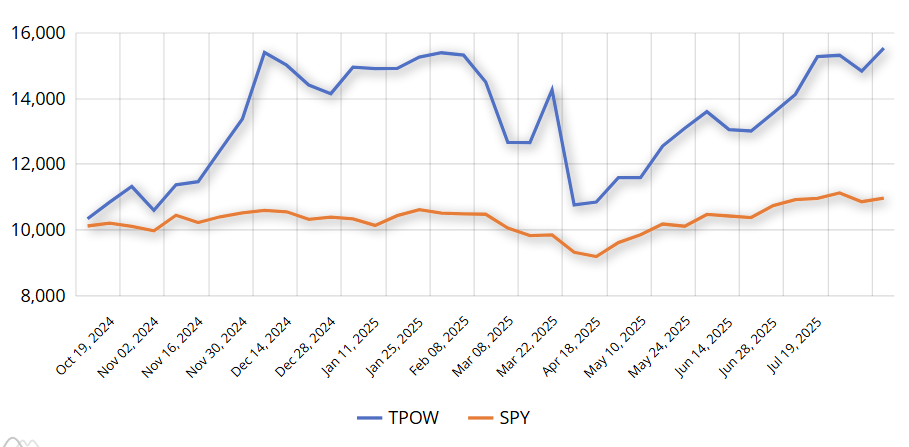
The Top Pick of the Week System is up +55 % vs the S&P 500 up +10% (since the Oct. 7, 2024 inception).
For busy investors that don’t have time to Swing Trade, we now have a simple Strategy:
Top Pick of the Week. You Buy the “Pick” on Monday morning, and then Sell on Friday’s Close. It’s a time-efficient approach designed to capture short-term gains without requiring constant market monitoring.
This “Pick” is emailed to you with this Weekly Commentary (see below & more details here).
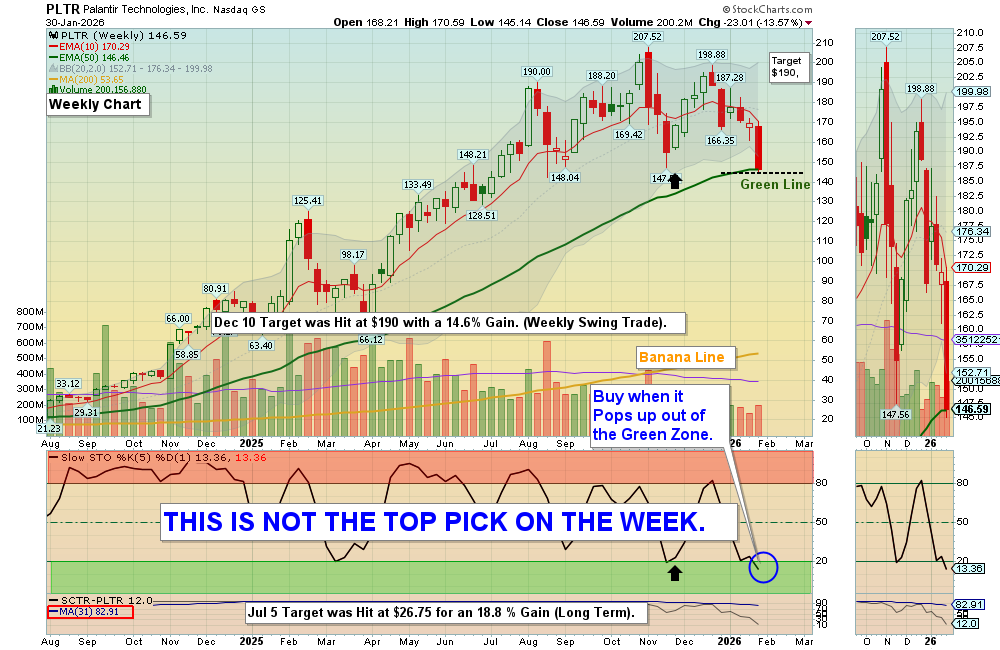
The Top Pick of the Week is: AeroVironment Inc. $AVAV to be bought on the Open on Monday, and will be sold on the Close 0n Friday.
You can view the current Weekly Stock Performance.
______________________________________________________________________________
DAILY SWING TRADING (SHORT TERM)Watch List and Charts to Buy Soon.
| Daily Swing Watch List to Buy | Daily Swing Charts to Buy |
| Current Daily Swing Positions | Current Swing Charts |
| Closed Daily Swing Results | Trading Dashboard |
8/10/2025 Markets were higher for the week, as the S&P 500 and NASDAQ 100 Funds are quickly back up retesting last weeks highs, on lower Volume. The S&P 500 dropped down last week but did not make it down to the Red Line (50-day avg.). There were too many “Buy the Dip” investors, as the HERD has MAX FOMO, and wants to get ALL in on this Buying Stampede. This panic Buying is very similar to the 2021 Top of FOMO Buying, after the end of COVID.
The Strongest Stocks and Indices are extremely overbought now after the April Fear Flush. Smart Money is Raising Cash to be able to Buy these Leaders on the next pull-back.
We Buy the strongest Leaders that make new highs, on pull-backs. So follow the Green Line System and you should continue to win more than you lose. SEE WATCH LIST
With the Green Line System, your Money should flow into the Strongest areas and your Account value should be able to grow in both Bull and Bear Markets. Follow the MONEY, not the MEDIA.
______________________________________________________________________________
For the week the Dow was up 1.42%, the S&P 500 was up 2.43% and the NASDAQ 100 was up 3.73%. The major Indices still have a Relative Strength below 80, so you should currently own the stronger Funds here.
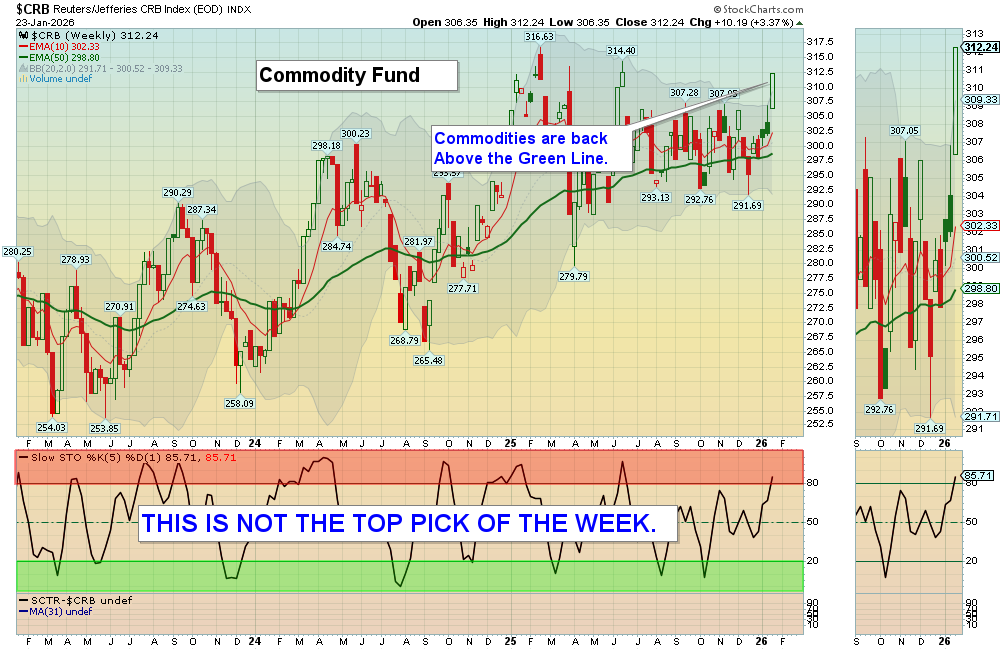
The Inflation Index (CRB) was down 0.41% this week and is Below the Green Line, indicating Economic Contraction.
Bonds were down 0.60% for the week, and are Below the Green Line, indicating Economic Expansion.
The US DOLLAR was down 0.89% for the week.
Crude Oil was down 5.91% for the week at $63.35 and GOLD was up 1.02% at $3397.28.
_______________________________________________________________________
DAY TRADERS: We are doing many profitable Day Trades on our Discord Trading Hub (free). Please join Discord or X (Twitter) with your cell phone app for the fastest Trade Alerts and Daily email notifications during the day. Other methods of notification have been too slow. Also, please check our our Live Trading Room on YouTube during Market hours.
_______________________________________________________________________
SWING TRADE COMPLETED TRADES:
BBAI & RCAT Slipped down to the Buy Price and was Stopped Out even.
IREN IREN Ltd. Target was Hit at $18.70 with a 16 % Gain.
SBET SharpLink Gaming Stopped Out via email at $23 for a 20.2 % Gain.
URA Uranium Fund Target was Hit $41 with a 3.8% Gain
We are now in 2 Three Star logged Swing Trading Positions for the Short Term. There are only 2 investments on the Short Term Watch List.
Completed Swing Trades thru July 2025: 142 Trades, + 366.54% Total. Avg. Trade = 2.58 % Gain (before taxes and commissions).
______________________________________________________________________________
WEEKLY GREEN ZONE POPS WATCH LIST
| Open Date | Symbol | Description | Industry | SCTR | Size | Last Price | Daily Change % | ATGL 60 Min | Comments | id | Strategy | Position | Sell Date | Sell Price | Purchase Price | Net Profit | Realized Gain/Loss % | ATGL Rule | Stop Loss | color | Chart | Update Date | Status | Unrealized Gain/Loss % | Volume | Post Type | # Shares | Amount Invested | Portfolio Weight | Dividend Rate | Current Yield | Current Value | Yield on Cost | Projected Annual Dividends | Total Dividends Received | Pay Back | Profit / Loss | Annualized Profit/Loss | Star Rating | Target Price | News Alert % | Target Triggered |
|---|---|---|---|---|---|---|---|---|---|---|---|---|---|---|---|---|---|---|---|---|---|---|---|---|---|---|---|---|---|---|---|---|---|---|---|---|---|---|---|---|---|---|
| 2026-07-08 | BW | Babcock & Wilcox | Financial | 96 | Small | $11.70 | 2.0942 | Wait for next Weekly Money Wave Close > 20 with High Volume. | 5123 | Long Term | Long | $0.00 | 0.00% | https://stockcharts.com/sc3/ui/?s=BW&a=2308001998&p=W&yr=1&mn=0&dy=0&id=p84859429849 | 2026-07-08 18:53:47 | open | 0.00% | 4264134 | Watch List | $0 | 0.00% | 0.00 | 0 | $0 | 0.00% | $0 | $0 | 0.00% | 0.00% | - | $17.00 | |||||||||||
| 2026-07-01 | NVTS | Navaitas Semi. | Semiconductor | 80 | Mid | $13.47 | -5.0071 | Wait for next Weekly Money Wave Close > 20 with High Volume. | 5114 | Long Term | Long | $0.00 | 0.00% | https://stockcharts.com/sc3/ui/?s=NVTS&a=2304700575&p=W&yr=1&mn=0&dy=0&id=p49574092537 | 2026-07-02 22:12:37 | open | 0.00% | 11170634 | Watch List | $0 | 0.00% | 0.00 | 0 | $0 | 0.00% | $0 | $0 | 0.00% | 0.00% | - | $24.00 | |||||||||||
| 2026-06-30 | NOK | Nokia Corp. | Telecom | 92 | Large | $12.44 | -3.5659 | Wait for next Weekly Money Wave Close > 20 with High Volume. | 5108 | Long Term | Long | $0.00 | 0.00% | https://stockcharts.com/sc3/ui/?s=NOK&a=2302004445&p=W&yr=1&mn=0&dy=0&id=p52583455345 | 2026-06-30 16:54:43 | open | 0.00% | 50198800 | Watch List | $0 | 0.00% | 0.16 | 1.2966 | $0 | 0.00% | $0 | $0 | 0.00% | 0.00% | - | $16.00 | |||||||||||
| 2026-06-29 | AAOI | Applied Opto | Telecom | 95 | Small | $119.92 | -1.8738 | Wait for next Weekly Money Wave Close > 20 with High Volume. | 5104 | Long Term | Long | $0.00 | 0.00% | https://stockcharts.com/sc3/ui/?s=AAOI&a=2300865339&p=W&yr=1&mn=6&dy=0&id=p68280620441 | 2026-07-05 19:24:45 | open | 0.00% | 6805518 | Watch List | $0 | 0.00% | 0.00 | 0 | $0 | 0.00% | $0 | $0 | 0.00% | 0.00% | - | $180.00 | |||||||||||
| 2026-06-26 | AA | Alcoa Corp. | Metals | 89 | Mid | $48.68 | -0.0821 | Wait for next Weekly Money Wave Close > 20 with High Volume. | 5101 | Long Term | Long | $0.00 | 0.00% | https://stockcharts.com/sc3/ui/?s=AA&a=2299172341&p=W&yr=1&mn=6&dy=0&id=p00174284214 | 2026-06-26 17:47:58 | open | 0.00% | 4987963 | Watch List | $0 | 0.00% | 0.40 | 0.8217 | $0 | 0.00% | $0 | $0 | 0.00% | 0.00% | - | $70.00 | |||||||||||
| 2026-06-25 | AXTI | Amer. Xtal Tech. | Semiconductor | 99 | Small | $57.21 | -8.5372 | Wait for next Weekly Money Wave Close > 20 with High Volume. | 5100 | Long Term | Long | $0.00 | 0.00% | https://stockcharts.com/sc3/ui/?s=AXTI&a=2300207248&p=W&yr=0&mn=9&dy=0&id=p61016637531 | 2026-07-01 19:29:27 | open | 0.00% | 7653885 | Watch List | $0 | 0.00% | 0.00 | 0 | $0 | 0.00% | $0 | $0 | 0.00% | 0.00% | - | $105.00 | |||||||||||
| 2026-06-17 | USO | US Oil Fund | Energy | 92 | ETF | $108.70 | -0.2844 | Wait for next Weekly Money Wave Close > 20 with High Volume. | 5092 | Long Term | Long | $0.00 | 0.00% | https://stockcharts.com/sc3/ui/?s=USO&a=2293225295&p=W&yr=1&mn=6&dy=0&id=p78387113253 | 2026-06-18 15:54:20 | open | 0.00% | 4488382 | Watch List | $0 | 0.00% | 0.00 | 0 | $0 | 0.00% | $0 | $0 | 0.00% | 0.00% | - | $135.00 | |||||||||||
| 2026-06-07 | SLV | Silver Fund | Metals | 93 | ETF | $53.95 | -0.3509 | Jul 6 Still Below the Green Line. AVOID | 5083 | Long Term | Long | $0.00 | 0.00% | https://stockcharts.com/sc3/ui/?s=SLV&a=2284537971&p=W&yr=1&mn=6&dy=0&id=p52385594523 | 2026-07-06 19:25:20 | open | 0.00% | 11734302 | Watch List | $0 | 0.00% | 0.00 | 0 | $0 | 0.00% | $0 | $0 | 0.00% | 0.00% | - | $80.00 |
Weekly Green Zone Pops- Click here for scrolling charts.
Completed Long Term Trades in 2024: 51 Trades, +333.46% Total, or 9.6 % / Trade (before taxes & commissions).
______________________________________________________________________________
Important Links| Top 100 | Stage Chart Investing | CNN Fear & Greed Index |
| Dividend Growth Portfolio | ETF Sector Portfolio | Dogs of the Dow |
| Long Term Strategy | Stage Chart Investing | Articles |
Alert! Market Risk is Medium (Yellow). The probability of successful Short Term Trades is better, when the % of stocks above the 50-day avg. is below 20.
Tell your Friends about the Green Line, and Help Animals.
______________________________________________________________________________
QUESTION: Alberto writes “AGL: Little question: what does the green dot on the portfolios holdings mean? Thank you.”
ANSWER: Hi Roberto, please click on the Symbol Link for a Daily Chart, and on the Green Dot to see the 60-min Chart of the Investment.
Good trading, and tell your friends!
ATGL