International Shipping Index: What It Reveals About Global Trade Trends
Smart traders know that the best investment opportunities often come from spotting trends before they hit mainstream economic reports. The ...
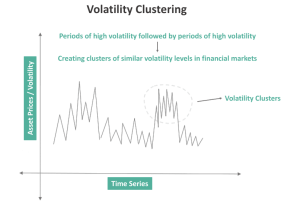
Volatility Clustering in Financial Markets: Understand Why It Happens
In the study of quantitative finance and market dynamics, few concepts are as foundational yet overlooked by the general investing ...
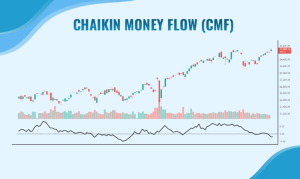
Chaikin Money Flow (CMF): How to Use Volume to Spot Real Market Strength
In technical analysis, price action often receives the most attention, yet volume serves as the essential fuel that drives price ...
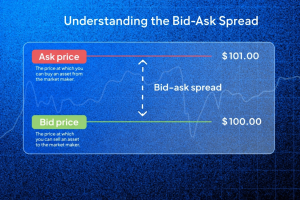
What Is the Bid Ask Spread? How It Impacts Every Trade You Place
What Is the Bid Ask Spread? How It Impacts Every Trade You Place In the global financial landscape, every transaction ...
How the Elder Impulse System Helps Traders Time Their Entries
The Elder Impulse System provides traders with a visual framework for timing entries by combining trend direction with momentum strength ...
Kelly Criterion Trading: How to Size Positions with Confidence
Successful trading requires more than selecting profitable securities. It demands disciplined risk management and precise position sizing. The Kelly Criterion ...
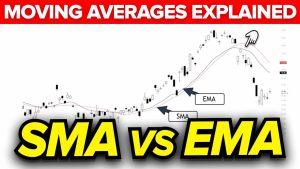
SMA vs EMA: Which Moving Average Works Best for Your Trading Strategy?
Moving averages help traders identify trends, time entries and exits, and filter market noise. The debate between simple versus exponential ...
Intermarket Analysis: How to Use Cross-Asset Signals to Read the Market
When examining individual stock charts, traders often focus on isolated price movements. However, financial markets operate as interconnected systems where ...
24-Hour Trading Explained: How Modern Markets Operate Around the Clock
Growing global investor demand for flexible trading access has made 24-hour trading an increasingly important feature in modern capital markets ...
What Are Trading Hotkeys and How They Can Transform Your Execution Speed
Execution speed separates profitable trades from missed opportunities in active markets. Trading hotkeys — keyboard shortcuts programmed to execute specific ...
Accumulation Distribution Indicator: How to Read Buying Pressure
Volume-based indicators play a critical role in technical analysis because they help traders understand how price is moving—not just where ...
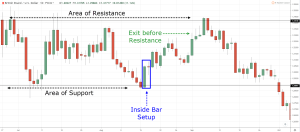
Inside Bar Trading Strategy: How to Spot High-Probability Setups
The inside bar trading strategy is one of the simplest price patterns on a chart—and one of the most misunderstood ...


