
By ATGL
Updated November 25, 2025
Successful trading requires analyzing the underlying strength of market movements through market breadth, which reveals whether rallies or declines reflect broad participation or narrow activity. The ARMS Index, commonly known as TRIN (Trading Index), serves as a real-time gauge of market sentiment by combining advancing and declining stocks with their corresponding volume data. This metric helps traders identify potential reversals, confirm market strength, and assess whether current conditions favor buyers or sellers.
What the ARMS Index (TRIN) Tells Traders About Market Pressure
The Arms Index TRIN indicator quantifies the relationship between market participation and volume flow. Unlike simple price-based metrics, TRIN incorporates both the number of advancing versus declining stocks and the volume behind those moves, revealing whether strong buying or selling pressure supports observed price action.
When market breadth and volume align, TRIN provides clear signals about prevailing sentiment. Readings below 1.0 indicate that advancing stocks attract disproportionate volume, suggesting bullish pressure. Readings above 1.0 signal that declining stocks command more volume, reflecting bearish sentiment. At 1.0, volume distributes proportionally across advancing and declining securities.
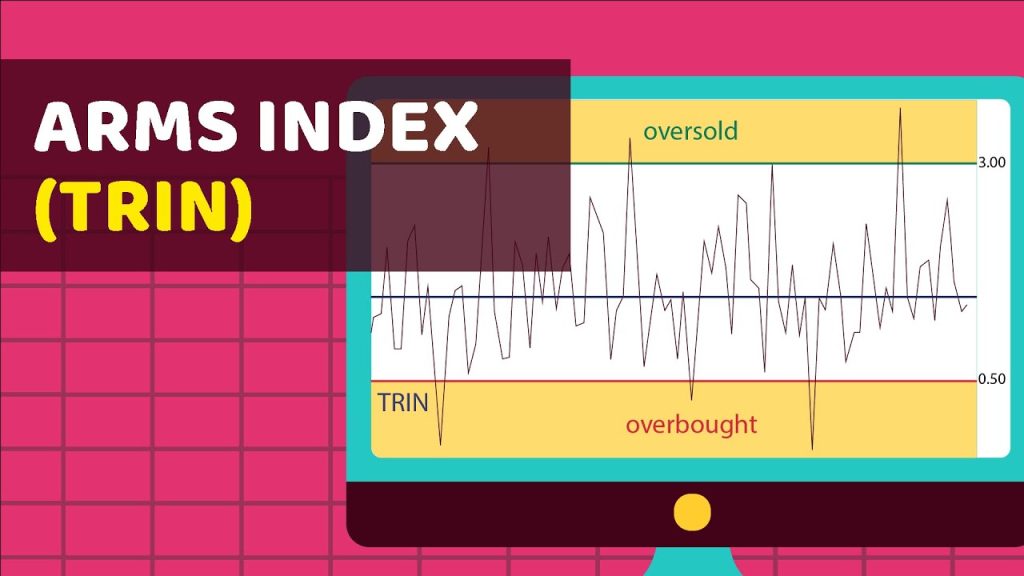
The Arms Index TRIN indicator excels at identifying short-term extremes. Readings below 0.50 often coincide with overbought conditions, while values above 3.0 may indicate oversold environments. These extreme readings help traders anticipate momentum shifts before they become evident in price charts alone.
Breaking Down the TRIN Formula (With a Simple Example)
The TRIN calculation divides two ratios to produce a single value that synthesizes breadth and volume data:
TRIN = (Advancing Issues / Declining Issues) / (Advancing Volume / Declining Volume)
Advancing Issues: Stocks trading higher than their previous close
Declining Issues: Stocks trading lower than their previous close
Advancing Volume: Total volume for all advancing stocks
Declining Volume: Total volume for all declining stocks
Consider a practical example. Assume 1,500 stocks advance while 1,000 decline. Advancing volume totals 800 million shares, and declining volume reaches 400 million shares:
TRIN = (1,500 / 1,000) / (800 million / 400 million)
TRIN = 1.5 / 2.0
TRIN = 0.75
This 0.75 reading indicates bullish conditions. Although more stocks advanced than declined (a 1.5 ratio), advancing volume outpaced declining volume by an even greater margin (a 2.0 ratio), demonstrating strong buying pressure beyond what breadth numbers alone would suggest.
If the volume distribution reversed—with 400 million shares advancing and 800 million declining—the TRIN would calculate to 3.0, signaling bearish pressure.
How TRIN Complements Other Market Breadth Indicators
The Arms Index TRIN indicator delivers maximum value when analyzed alongside other technical indicators for trading.
Advance-Decline Line
The Advance-Decline Line tracks the cumulative difference between advancing and declining stocks over time. While TRIN reveals immediate volume-weighted sentiment, the A-D Line shows whether breadth trends support sustained price movements. A rising A-D Line with TRIN readings consistently below 1.0 confirms healthy uptrend conditions.
Volume Trends
TRIN incorporates volume data directly, but traders strengthen their technical analysis by consulting dedicated volume indicators such as On-Balance Volume or the Accumulation/Distribution Line. When TRIN signals extreme readings while volume indicators show distribution, traders receive reinforced warnings about potential weakness.
Momentum Readings
Market sentiment indicators like the Relative Strength Index or MACD measure price momentum without directly incorporating breadth data. A momentum indicator showing oversold conditions paired with TRIN readings above 3.0 strengthens the case for a potential bounce. Similarly, overbought momentum readings coupled with TRIN below 0.50 suggest increased reversal risk.
Using TRIN in Real Trading Setups
Professional traders apply the Arms Index TRIN indicator across various scenarios to time entries, confirm breakouts, and manage risk. These can include:
- Intraday Reversals: Day traders monitor TRIN for extreme readings during market hours. A TRIN spike above 2.5 during a sharp selloff may signal capitulation, presenting opportunities for counter-trend positions. Traders often wait for TRIN to retreat below 1.0 before entering long positions.
- Breakout Confirmation: When a major index breaks resistance on high volume, TRIN readings below 1.0 validate the move. This confirmation reduces the likelihood that a breakout results from narrow leadership. Breakouts accompanied by TRIN above 1.0 warrant caution.
- Swing Trade Entries: Swing traders incorporate TRIN into position management. Persistent TRIN readings below 1.0 during an uptrend suggest healthy participation. If TRIN begins registering consistent readings above 1.0 while the index continues rising, this divergence may prompt profit-taking.
- Volume-Price Analysis: TRIN helps traders distinguish between price movements driven by volume versus thin trading. A rally with TRIN at 0.60 demonstrates volume concentration in advancing stocks, increasing confidence in the move’s sustainability.
The Limitations of TRIN (and How Traders Manage Them)
Despite its value, the Arms Index TRIN indicator presents the following challenges that require awareness and mitigation strategies:
- Short-Term Focus: TRIN excels at revealing immediate market conditions but provides limited insight into long-term trends. Pairing TRIN with longer-term breadth indicators like the percentage of stocks above their 200-day moving averages creates better perspective for position traders.
- Algorithmic Trading Distortions: Modern markets feature significant algorithmic trading activity that can produce rapid TRIN fluctuations unrelated to genuine sentiment shifts. Traders can filter noise by focusing on sustained readings rather than momentary extremes.
- Calculation Variations: Different data providers may calculate TRIN using varying stock universes. Traders should understand which stocks their data provider includes and maintain consistency in their analysis source.
- False Signals in Trending Markets: Strong trends may generate persistently skewed TRIN readings without indicating imminent reversals. Traders manage this limitation by requiring additional confirmation from trend indicators like moving averages before acting on TRIN signals.
- Low-Volume Periods: TRIN readings during market open and close can be unreliable due to low participation. Professionals typically discount TRIN values during the first and last 30 minutes of trading.
Strengthen Your Market Analysis With TRIN
The Arms Index TRIN indicator provides traders with a quantitative method to assess market breadth and volume relationships in real time. Readings below 1.0 signal bullish pressure, while readings above 1.0 indicate bearish conditions, with extreme values often preceding short-term reversals.
Successful implementation requires integrating TRIN with complementary analysis tools. When TRIN confirms signals from volume studies, momentum indicators, and traditional breadth metrics, traders gain confidence in their market assessments.
Above the Green Line offers comprehensive tools and strategies that help traders analyze market conditions with precision. Explore our membership options to access professional-grade analysis tools and strategies that incorporate TRIN alongside other essential market indicators.

Related Articles

Margin Call Explained: What Triggers It and How to Avoid One

AMC Short Squeeze Explained: Timeline, Causes, and Trading Risks

Volatility Clustering in Financial Markets: Understand Why It Happens

Chaikin Money Flow (CMF): How to Use Volume to Spot Real Market Strength
