By Andrew Stowers
Updated June 30, 2026
Dividends per share is the foundational number in dividend investing — but most investors find the pre-calculated figure on a financial data site without understanding where it comes from, whether it is trailing or forward, and how to use it to evaluate a dividend stock’s quality.
This guide covers three ways to calculate DPS, exactly where to find the inputs in financial statements and data services, the difference between trailing and forward DPS, how DPS connects to dividend yield and the dividend growth rate, and what the number actually tells you — and doesn’t tell you — about the quality of a dividend. We also have a more in-depth resource covering all things Dividend Growth Investing that we highly encourage you to read after finishing this article to see how this all fits into the bigger picture.
What Is Dividends Per Share (DPS)?
| Quick Answer
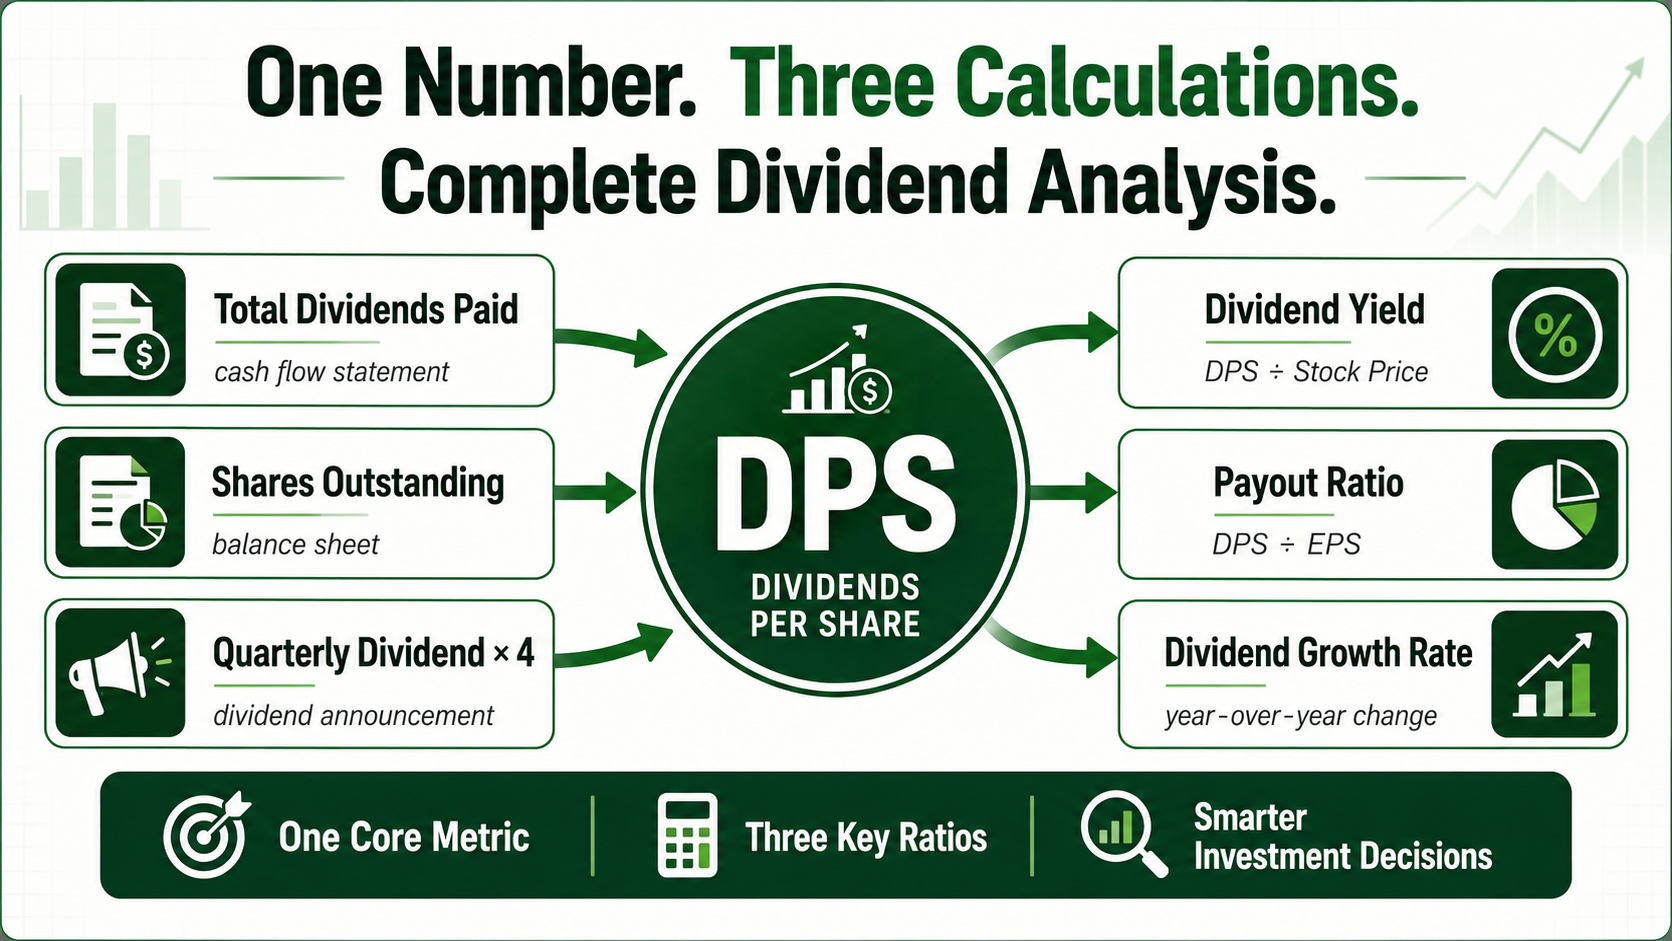
Dividends per share (DPS) is the total amount of dividends paid to shareholders divided by the number of shares outstanding. It represents the dollar income received per share from a company’s dividend distributions — the primary input for yield, payout sustainability, and dividend growth rate analysis. |
DPS tells shareholders the specific dollar amount they receive per share owned. If you own 200 shares of a company with DPS of $2.40, your annual dividend income from that position is $480 (200 × $2.40).
DPS in the Broader Analytical Framework
DPS does not exist in isolation — it connects to four other critical metrics:
- Dividend yield: DPS ÷ Stock Price — the income return expressed as a percentage of current price
- Payout ratio: DPS ÷ Earnings Per Share (EPS) — what percentage of earnings is being paid out as dividends
- Dividend growth rate: year-over-year change in DPS — the trajectory of income growth over time
- Gordon Growth Model: Forward DPS ÷ (Required Return − Dividend Growth Rate) — a dividend-based stock valuation
DPS vs Total Dividends Paid
DPS is the per-share metric relevant to individual investors. Total dividends paid is the company-level aggregate: if DPS is $2.40 and the company has 1 billion shares outstanding, total dividends paid = $2.4 billion. Financial statements report total dividends paid (as a cash flow item); DPS is derived by dividing that figure by shares outstanding.
The DPS Formula: Three Calculation Methods
Method 1 — From Annual Financial Statements
DPS = Total Dividends Paid ÷ Weighted Average Shares Outstanding
Use weighted average shares (not period-end shares) because share counts may change during the year through issuance or buybacks. Total dividends paid comes from the cash flow statement; weighted average shares from the income statement denominator.
Worked example: company paid $480 million in total dividends; weighted average shares outstanding = 960 million. DPS = $480M ÷ 960M = $0.50 per share.
Method 2 — Annualized From Most Recent Quarterly Declaration
Forward Annual DPS = Most Recent Quarterly DPS × 4
This is the most practical method for evaluating current income — it reflects the actual rate at which the company is currently paying dividends, not a historical blend.
Worked example: company most recently declared a quarterly dividend of $0.55 per share. Forward annual DPS = $0.55 × 4 = $2.20.
Limitation: assumes the quarterly rate is maintained for all four quarters. Any dividend increase or cut will change the actual forward DPS.
Method 3 — Direct from Dividend Declaration
Companies announce each dividend directly in a press release stating the exact per-share amount. This declaration is the most authoritative DPS source and requires no calculation. Most investor relations pages maintain a complete dividend history with each declared amount per share.
When the Three Methods Differ
If a company raised its quarterly dividend mid-year from $0.40 to $0.55: Method 1 (annual from statements) reflects the blended historical year (~$0.40×3 + $0.55×1 = $1.75 annual DPS); Method 2 (current quarterly × 4) reflects the current run rate ($0.55 × 4 = $2.20). For evaluating current income, Method 2 is more relevant. For historical DPS trend analysis, Method 1 provides the accurate historical data.
Where to Find the Inputs
Most investors never need to calculate DPS manually — the data is available pre-calculated. But knowing where to find and verify the underlying inputs is essential data hygiene.
SEC EDGAR (Primary Source for Verification)
Navigate to sec.gov/edgar → search the company name → select the most recent 10-K (annual report) or 10-Q (quarterly). In the financial statements, find the Cash Flow Statement → Financing Activities section → look for ‘Dividends paid to shareholders’ or ‘Cash dividends.’ This will appear as a negative number (cash outflow). Divide by weighted average diluted shares (from the income statement EPS denominator) to verify DPS.
Yahoo Finance
Navigate to the stock page → click ‘Statistics’ tab → scroll to ‘Dividends & Splits’ section. ‘Annual Dividend Rate’ shows the forward annualised DPS (current quarterly × 4). ‘Trailing Annual Dividend Rate’ shows the sum of the four most recently declared quarterly dividends. ‘Forward Dividend Yield’ uses forward DPS ÷ current price. Both forward and trailing figures are displayed.
Macrotrends
Search ‘[company name] dividend per share history’ on Macrotrends.net. Shows annual DPS going back decades with a clean historical chart — the best free resource for long-term dividend growth analysis and trend visualization.
Company Investor Relations Page
Each quarterly earnings release and dividend press release states the exact declared dividend per share. Investor relations pages maintain a ‘Dividends’ section with the complete declaration history. This is the most authoritative real-time source and updates with each new declaration before any financial data site reflects the change.
DPS and the Dividend Yield Formula
| The Yield Formula
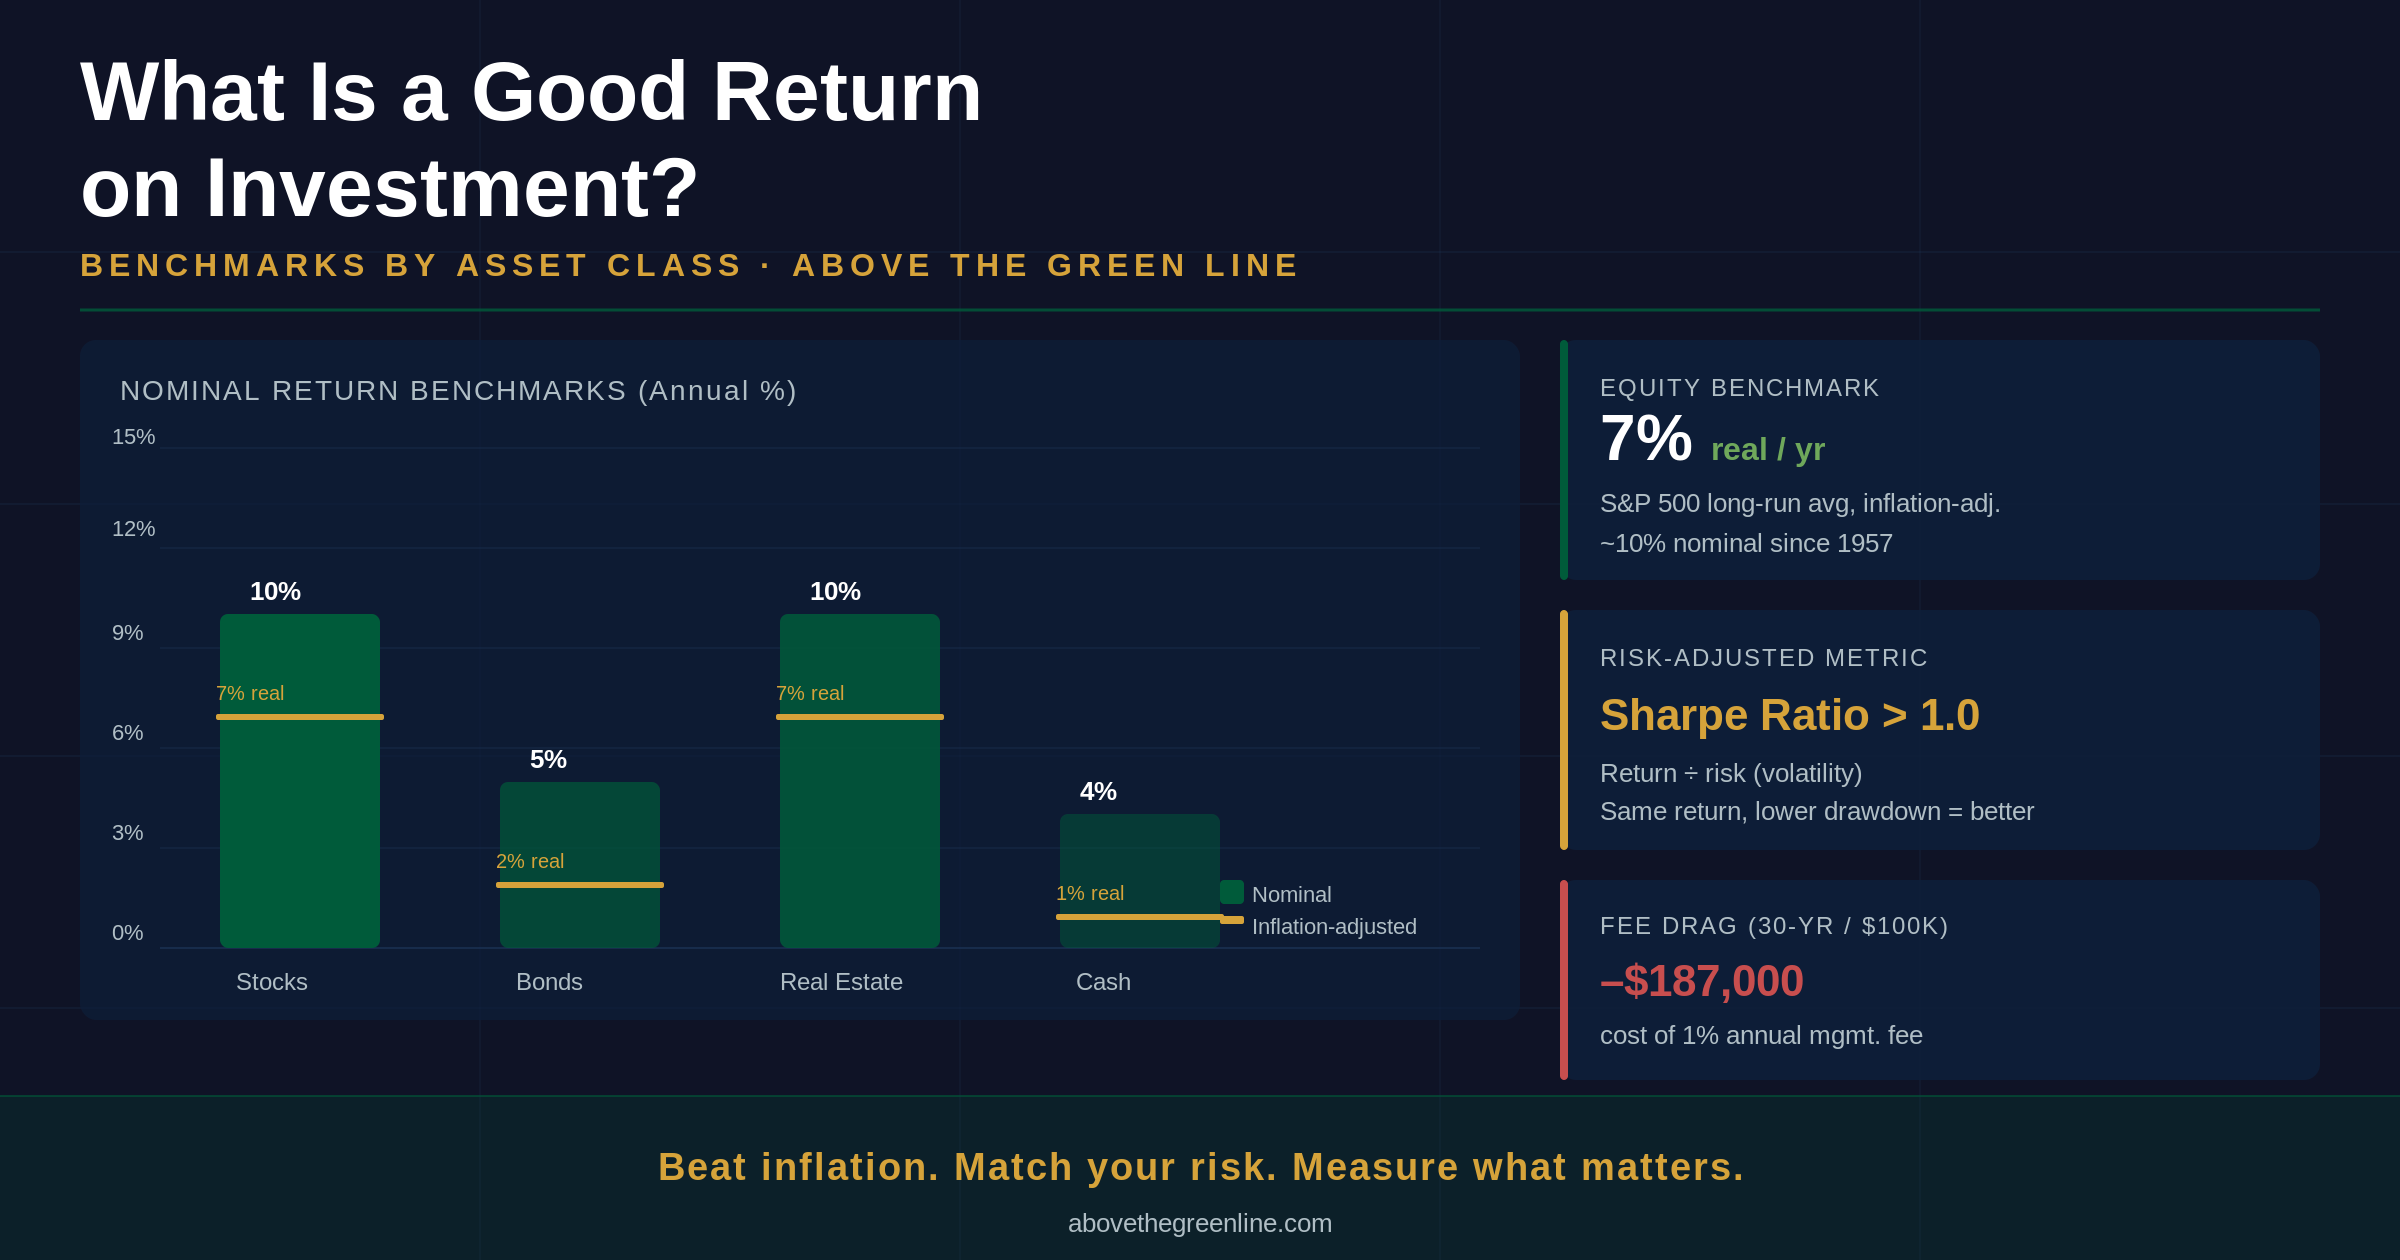
Dividend Yield (%) = Annual DPS ÷ Current Stock Price × 100. A company paying $2.40 DPS with a $60 stock price yields 4.0%. The same $2.40 DPS at $80 yields 3.0%. At $40 it yields 6.0%. Same dividend, three different yield signals — the price changes everything. |
The Price-Yield Inverse Relationship
As stock price rises and DPS stays constant, yield falls. As stock price falls and DPS stays constant, yield rises. This inverse relationship creates the ‘yield trap’ scenario: a falling stock price mechanically produces a rising yield that appears attractive — but may reflect an impaired business about to cut its dividend. A high and rising yield without dividend growth is a warning sign, not an opportunity.
Yield-on-Cost: The Long-Term Dividend Investor’s Metric
Once you own a dividend stock, your personal yield is DPS relative to your purchase price — not the current market price. If you bought a stock at $40 and DPS has since grown to $2.40, your yield-on-cost is 6.0% — even if the stock now trades at $80 and the current market yield is 3.0%. Yield-on-cost is the metric that reveals the compounding power of dividend growth investing over time.
Comparing Yield Across Asset Classes
Dividend yield can be compared to bond yields to assess relative attractiveness: a 4% dividend yield from a company with 10+ years of consecutive dividend growth provides the same current income as a 4% bond coupon — but with the potential for growing income as DPS increases over time. The bond’s coupon is fixed; the dividend stock’s income trajectory is upward.
DPS and the Payout Ratio: Checking Dividend Sustainability
Payout Ratio = DPS ÷ Earnings Per Share (EPS). A payout ratio of 50% means the company pays half its earnings as dividends and retains the rest. A payout ratio above 100% means the company is paying more than it earns — drawing down reserves or adding debt to fund the dividend.
| Sector | Typical Sustainable Payout | Notes |
|---|---|---|
| Utilities | 60-80% | Stable regulated revenues; high yields common |
| REITs | 70-90% of FFO | Must distribute 90% of income by law; use FFO not EPS |
| Consumer Staples | 50-70% | Steady earnings; manageable range |
| Technology | 20-40% | Retain more for reinvestment; growing dividends |
| Financials | 30-50% | Regulated capital requirements constrain payout |
Warning Signals in Payout Ratio
- Payout ratio above 80% in a cyclical business: earnings drop in recessions, threatening the dividend
- Payout ratio consistently rising over 5 years (40% → 70%) while earnings growth slows: dividend growth outpacing earnings growth is unsustainable long-term
- Payout ratio above 100%: paying more than earning; only sustainable if temporary or if cash flow supports it
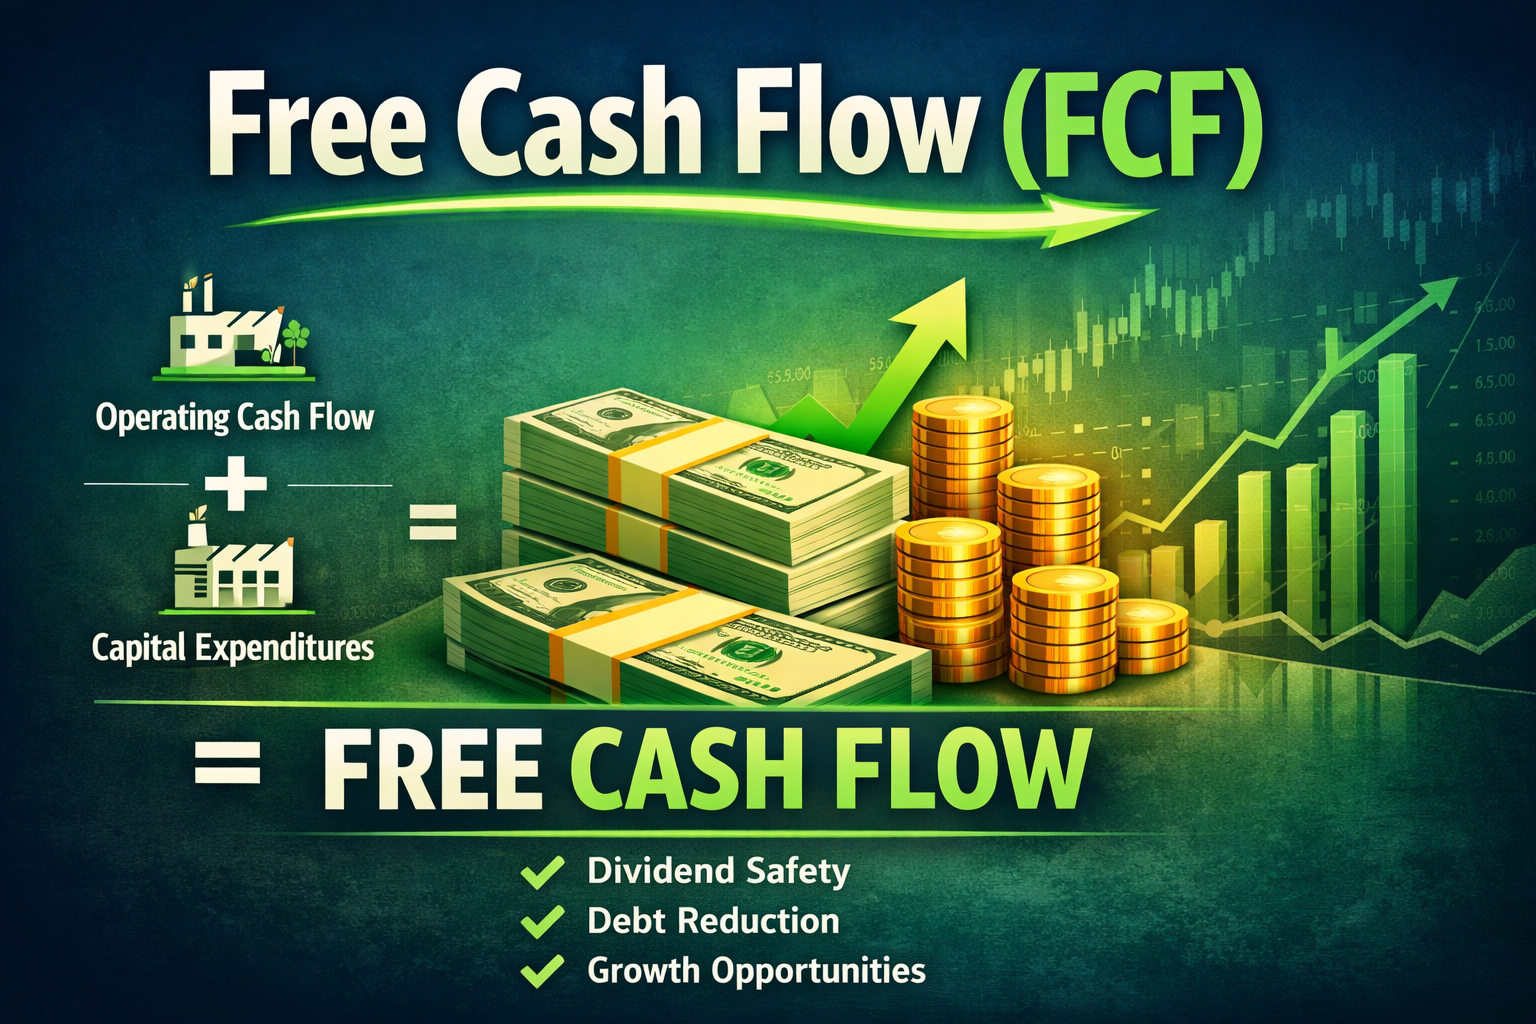
Free Cash Flow Payout Ratio
DPS ÷ Free Cash Flow Per Share = FCF Payout Ratio. Many analysts prefer this metric because earnings can include non-cash items while FCF represents actual cash generated. A company with 50% EPS payout but 75% FCF payout has less cushion than the EPS ratio suggests. FCF payout is particularly important for capital-intensive businesses where earnings overstate actual cash generation.
Trailing vs Forward DPS: Which Are You Looking At?
This distinction is critical and almost never explained on financial data sites.
Trailing DPS
The sum of actual dividends paid over the most recent 12 months — historical fact. More reliable as a statement of what was actually paid. Less useful if the company recently raised or cut its dividend because the trailing figure blends old and new rates.
Forward DPS
Most recent quarterly dividend × 4. Reflects the current annualized run rate at the current dividend level. More relevant for evaluating current income attractiveness. Assumes the quarterly rate continues — any change affects the actual forward income.
A Practical Example: Recent Dividend Raise
Company raised its quarterly dividend from $0.40 to $0.55 in the most recent quarter. Trailing DPS: 3 × $0.40 + 1 × $0.55 = $1.75. Forward DPS: $0.55 × 4 = $2.20. Using trailing DPS understates current income by $0.45 per share annually and produces a lower yield calculation. For current yield analysis, always use forward DPS.
Which Sites Show Which
Yahoo Finance: ‘Annual Dividend Rate’ = forward (current quarterly × 4); ‘Trailing Annual Dividend Rate’ = sum of last 4 declarations. Morningstar: typically shows trailing DPS. Macrotrends: historical trailing DPS by year. When in doubt, check the data source’s methodology footnote.
DPS, Dividend Growth Rate, and the Gordon Growth Model
Calculating the Dividend Growth Rate
Single-year growth rate: (Current Year DPS ÷ Prior Year DPS) − 1.
Compound Annual Growth Rate (CAGR) over multiple years: (Current DPS ÷ DPS n Years Ago) ^ (1/n) − 1.
Worked example: DPS grew from $1.00 to $2.00 over 10 years. CAGR = (2.00/1.00)^(1/10) − 1 = approximately 7.18% per year. An investor who bought when DPS was $1.00 at a stock price of $25 (original yield 4.0%) now receives $2.00 DPS — a yield-on-cost of 8.0% on the original investment.
The Gordon Growth Model Connection
The Dividend Discount Model (Gordon Growth Model) uses DPS and dividend growth rate as its two primary inputs to estimate a stock’s fair value: Stock Value = Forward DPS ÷ (Required Rate of Return − Dividend Growth Rate).
Worked example: stock paying forward DPS of $2.40, historically growing DPS at 4% per year, and requiring an 8% total return. Implied fair value = $2.40 ÷ (0.08 − 0.04) = $2.40 ÷ 0.04 = $60.00. If the stock trades at $50, it may be undervalued based on this model; at $80, potentially overvalued.
This is an approximation framework — not a precise valuation tool. The model is highly sensitive to the assumed growth rate and required return; small changes produce large valuation swings. Use it for directional insight and relative comparison, not as a precise price target.
What DPS Does and Doesn’t Tell You
DPS reveals: the absolute income per share, the historical commitment to dividends (track record), the current yield, and the sustainability trajectory (through payout ratio). DPS does not reveal: whether the business will continue growing, whether total return will be competitive with alternatives, or whether the dividend is permanent — companies do cut dividends.
Total return — price appreciation plus dividend income — is the complete performance metric. High DPS with declining share price can produce poor total returns; moderate DPS with consistent dividend growth and share price appreciation can compound wealth significantly.
DPS: The Starting Point for Complete Dividend Analysis
Dividends per share is not a difficult calculation — but understanding all its dimensions converts it from a number on a data site into an analytical tool.
The complete DPS framework:
- Formula: Total Annual Dividends Paid ÷ Weighted Average Shares; or current quarterly × 4 for forward DPS
- Three sources: SEC EDGAR 10-K (authoritative), Yahoo Finance Statistics tab, company investor relations page
- Dividend yield: DPS ÷ Price; yield rises as price falls; yield-on-cost compounds over time
- Payout ratio: DPS ÷ EPS; sector benchmarks; FCF payout as the conservative alternative
- Trailing vs forward: always use forward DPS for current income analysis
- Dividend growth rate CAGR: (Current/Prior) ^ (1/n) − 1; 7.18% example on $1→$2 over 10 years
- Gordon Growth Model: Forward DPS ÷ (Required Return − Growth Rate) = approximate fair value
| Build Your Dividend Portfolio With ATGL’s Analytical Framework
At AboveTheGreenLine.com we give dividend investors the complete system — from DPS calculation through payout ratio analysis, dividend growth rate tracking, and Gordon Growth Model valuation — alongside the active portfolio management strategies that optimize income and total return. Join us Above the Green Line. |
Frequently Asked Questions
How do you calculate the annual dividend per share?
Annual dividend per share can be calculated two ways: (1) Sum of all quarterly dividends paid during the year — if a company paid $0.50, $0.52, $0.52, $0.54 per quarter, annual DPS = $2.08; (2) Forward annualised: most recent quarterly DPS × 4 — if currently $0.55 per quarter, forward annual DPS = $2.20. Method 2 is preferred for current yield calculations because it reflects the current rate, not a historical average that may include lower past payments.
Where can I find dividends per share data?
DPS is pre-calculated on Yahoo Finance (Statistics → Dividends & Splits), Macrotrends (historical DPS by year), and the company’s investor relations page (each quarterly dividend announcement states the exact declared DPS). The SEC EDGAR 10-K and 10-Q contain the underlying total dividends paid figure in the cash flow statement (Financing Activities) for manual calculation or verification.
What is the difference between dividend per share and dividend yield?
Dividends per share (DPS) is an absolute dollar amount — the income per share ($2.40, for example). Dividend yield is DPS expressed as a percentage of the current stock price — the same $2.40 DPS produces a 4.0% yield at $60/share and a 3.0% yield at $80/share. DPS is the input; yield is the relative measure that enables comparison across different-priced stocks and against bonds.
What is the Gordon Growth Model and how does DPS fit in?
The Gordon Growth Model (Dividend Discount Model) estimates a stock’s fair value using: Stock Value = Forward DPS ÷ (Required Rate of Return − Dividend Growth Rate). If forward DPS is $2.40, the required return is 8%, and the historical dividend growth rate is 4%, implied fair value = $2.40 ÷ (0.08 − 0.04) = $60.00. This makes forward DPS and the dividend growth rate the model’s two key inputs. The model is sensitive to both assumptions — use it for directional insight, not precision.