By Andrew Stowers
Updated June 19, 2026
A 10% return sounds great — until you realize your benchmark index earned 14% that same year while taking on half the risk. That single observation exposes the central problem with asking what is a good return on investment: the number alone tells you almost nothing without the context of asset class, inflation, and risk. The S&P 500 has averaged roughly 10% annually in nominal terms since 1957, and about 7% after inflation — but the range in any single year runs from negative 38% (2008) to positive 32% (2013). A good return is not a fixed target. It is a relative benchmark calibrated to what you own, the time horizon you are working with, and the drawdown you can tolerate without abandoning the strategy. This article covers the benchmarks by asset class, the most common ways nominal ROI misleads investors, and a three-step framework for setting a personalized return target. For the broader context of how returns fit into a long-term dividend growth investing guide, the pillar page covers the full strategy.
What Is a Good Return on Investment? The Short Answer
| Quick Answer
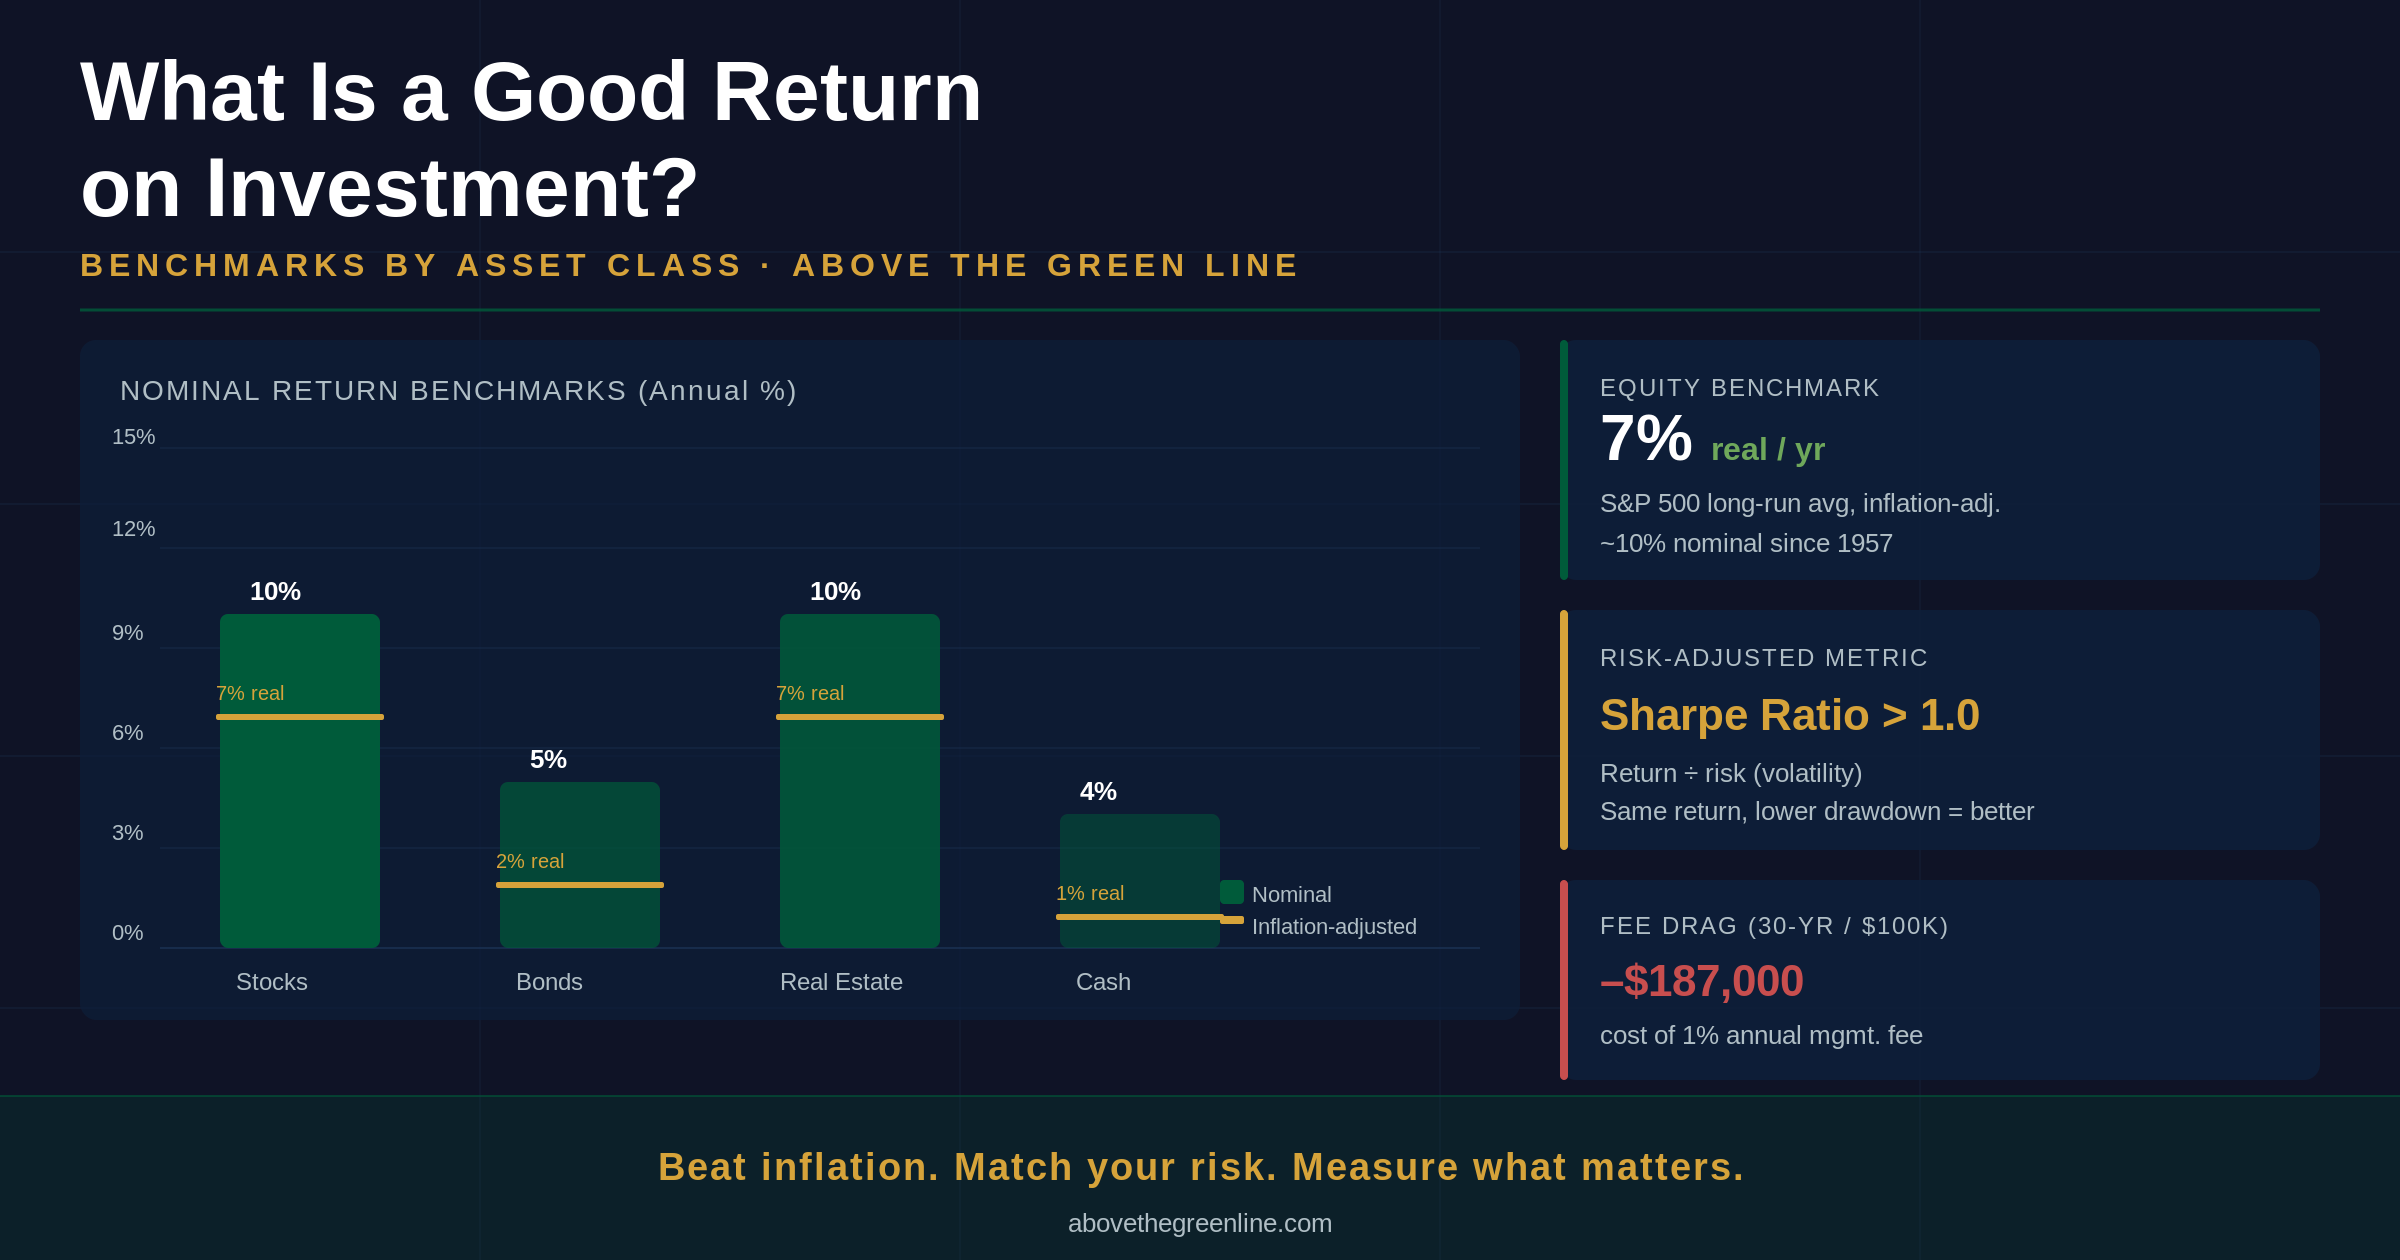
A good return on investment for stocks is 7% annually after inflation — the S&P 500’s long-run average. For bonds, 4–6% nominal is a reasonable benchmark. For real estate, 10%+ annually is considered strong. The right ROI target depends on your asset class, time horizon, and the risk you are willing to accept. |
The Stock Market Benchmark
The S&P 500 is the most commonly cited equity benchmark for a reason: it represents the broadest accessible measure of U.S. large-cap performance across more than six decades. From 1957 through 2024, the index has delivered approximately 10.3% annually in nominal terms and roughly 7% after adjusting for inflation using CPI. These figures include dividend reinvestment, which is why total return matters more than price appreciation alone. An equity investor who consistently achieves 7% real returns over 30 years will double their inflation-adjusted wealth roughly every 10 years via the rule of 72.
Year-to-year variance, however, is wide. The index has posted single-year gains above 25% and losses below negative 30% within the same decade. A 7% average is only meaningful over multi-decade horizons — short-term deviations are expected and large.
Why Inflation Adjustment Is Non-Negotiable
Inflation is the silent tax on investment returns. If your portfolio returns 8% in a year when inflation runs 4%, your real purchasing power grew by approximately 3.8% — not 8%. Most investors compare nominal returns to nominal benchmarks, which is mathematically consistent but can obscure whether real wealth is actually being built. The correct starting question is not “did I earn 7%?” but “did I earn enough above inflation to justify the risk I took?”
How to Calculate Your ROI
The Standard ROI Formula
The basic return on investment formula is straightforward:
ROI = (Current Value – Cost of Investment) ÷ Cost of Investment × 100
For a concrete example: if you invest $10,000 in a stock and it grows to $13,000, your ROI is ($13,000 – $10,000) ÷ $10,000 × 100 = 30%. That is the total return over the holding period, regardless of how long you held it. Use the How to Find Rate of Return: Overview and Formula for a detailed breakdown of the rate of return calculation and its variants.
Annualized ROI: The Correct Comparison Metric
Simple ROI does not account for time. A 30% gain over 2 years is very different from a 30% gain over 10 years. Annualized ROI — technically the Compound Annual Growth Rate (CAGR) — converts any total return into an equivalent annual rate, allowing apples-to-apples comparisons:
CAGR = (Ending Value ÷ Beginning Value)^(1 ÷ Years) – 1
On a $10,000 investment that grew to $13,000 over 3 years: CAGR = ($13,000 ÷ $10,000)^(1/3) – 1 = 9.14% per year. That annualized figure is what you compare against a benchmark, not the 30% total.
Step-by-Step ROI Calculation
- Step 1: Identify your total cost — purchase price plus any fees, commissions, or carrying costs.
- Step 2: Identify your ending value — current market value plus any income received (dividends, rent, interest).
- Step 3: Apply the ROI formula. If the holding period exceeds one year, convert to CAGR for meaningful comparison.
- Step 4: Subtract inflation from your nominal result to get the real return that actually grew your purchasing power.
A common mistake: counting gross gains without subtracting fees, taxes, and inflation. A 10% nominal return net of 1% in fees, 2% in taxes, and 3% inflation is a 4% real return — not 10%.
Good ROI Benchmarks by Asset Class
The table below summarizes the standard benchmarks for each major investable asset class. These represent long-run historical averages — individual years will deviate significantly.
| Data Verification Note
The figures below are long-run historical approximations. Verify current benchmarks against up-to-date data before publishing or making investment decisions. Yields and return expectations shift with the interest rate environment. |
| Asset Class | Nominal Return Benchmark | Inflation-Adjusted Target | Typical Risk Level |
|---|---|---|---|
| Stocks (S&P 500) | ~10% nominal | ~7% after inflation | Medium–High |
| Bonds (Gov’t) | 4–6% nominal | 1–3% after inflation | Low–Medium |
| Real Estate | 8–12% nominal | 5–9% after inflation | Medium |
| Cash / Money Mkt | 3–5% nominal | 0–2% after inflation | Very Low |
Stocks: The Equity Premium
The 7% real return benchmark for equities reflects the equity risk premium — the extra return investors demand for holding volatile assets instead of safe bonds. In practice, this premium is not stable: it compresses during bull markets when valuations rise faster than earnings, and expands during corrections. The S&P 500 long-run average is the right benchmark for a diversified equity portfolio. Concentrated single-stock positions can legitimately target higher returns, but must be evaluated against the additional volatility incurred. See Internal Rate of Return vs Net Present Value Explained for how IRR applies to multi-year equity positions.
For dividend-focused portfolios, the total return target typically splits into yield plus growth: a 3% dividend yield plus 5% dividend growth approximates the 7–8% total return range common in dividend growth strategies. The How to Use Net Present Value (NPV) for Dividend Stocks article covers how NPV applies to dividend stream valuation.
Bonds: Safety With a Real Return Cost
Government bonds in the 4–6% nominal range have historically delivered minimal real returns — often just 1–3% after inflation. This is the cost of their safety: bonds reduce portfolio volatility but are not wealth-building instruments on their own. High-yield corporate bonds offer higher nominal yields (historically 5–8%) but with meaningfully higher default risk. The correct bond benchmark is the relevant bond index for the duration and credit quality you hold — not an equity return.
Real Estate: The Complete Return Picture
Real estate ROI calculations must include both price appreciation and rental income (cap rate), minus operating costs, vacancy, maintenance, and leverage costs. A property that appreciates 5% annually with a 6% cap rate might show an 11% gross return — but net of costs, leverage interest, and vacancy, the actual realized return narrows considerably. The 8–12% benchmark for real estate reflects gross total returns in favorable markets. Investors using leverage can amplify these figures, which also amplifies downside risk proportionally.
Why Nominal ROI Can Mislead You
Inflation Erosion: The Silent Fee
If your portfolio returns 6% in a year when inflation runs 4%, your real gain is not 6% — it is approximately 1.9% (using the real return formula: (1.06 ÷ 1.04) – 1). Over time, this distinction compounds dramatically. An investor who earns 6% nominal for 20 years with 3.5% average inflation ends the period with a real return of roughly 2.4% annually — turning a seemingly solid nominal gain into barely-above-zero real wealth creation. For a deep dive into related return metrics, see Return on Equity (ROE): Definition, Calculations, and Why It Matters and Return on Assets Formula and Calculation — both illustrate how return metrics require context to be meaningful.
Fee Drag: The Compound Cost Most Investors Underestimate
A 1% annual management fee sounds trivial. Compounded over 30 years on a $100,000 starting portfolio earning 7% nominal, it reduces ending wealth from approximately $761,000 to $574,000 — a $187,000 reduction, or nearly 25% of the terminal portfolio value. This is the fee drag calculation most investment marketing material obscures. For actively managed funds, layered fees (management fee + fund expense ratio + trading costs) frequently total 1.5–2.5% annually, turning a benchmark-tracking strategy into a structurally disadvantaged one.
Risk-Adjusted Return: The Measure That Actually Matters
Two portfolios can deliver identical 10% annual returns with dramatically different risk profiles. Portfolio A achieves 10% with a 12% annual standard deviation (low volatility). Portfolio B achieves 10% with a 28% standard deviation (high volatility). Portfolio A is objectively superior — it generates the same return while exposing you to roughly half the peak drawdown risk. The Sharpe Ratio measures this: it divides excess return (above the risk-free rate) by the portfolio’s standard deviation. A higher Sharpe Ratio means more return per unit of risk taken. A portfolio with a 1.0+ Sharpe Ratio is generally considered efficient. Chasing high nominal returns while ignoring Sharpe degrades real wealth outcomes, because high-volatility portfolios trigger behavioral selling at the worst times.
How to Set a Personalized ROI Target
The Three-Step Framework
The mistake most investors make is adopting a generic return target — “10% per year” or “beat the S&P 500” — without anchoring it to their specific risk tolerance, time horizon, and asset allocation. The following three-step framework corrects that.
- Step 1: Set Your Inflation-Adjusted Baseline — Your minimum acceptable return is the current inflation rate. In a 3–4% inflation environment, a 3.5% nominal return in bonds is near-zero in real terms. Establish your floor first: what is today’s CPI, and what nominal return do you need to stay ahead of it? If CPI is 3.2% and you need 4% real growth, your nominal target is approximately 7.3%.
- Step 2: Identify Your Risk-Equivalent Benchmark — A 60/40 stock/bond portfolio should not be benchmarked against a pure equity index. Match your benchmark to your actual allocation: if you hold 60% equities and 40% bonds, your benchmark is a blended 60/40 index return (historically around 7–8% nominal). Comparing a balanced portfolio to the S&P 500 sets an impossible benchmark and triggers unnecessary portfolio changes.
- Step 3: Evaluate Drawdown Against Your Realized Return — Ask: how did I actually behave during the largest drawdown of the past year? If a 20% paper loss triggered selling, your realized return was far below the nominal figure the portfolio eventually recovered to. A good return target must account for the return you actually capture — not the return the strategy generates on paper while you sell at the bottom. Rules-based stop-loss systems address this directly by defining exit points in advance, removing the behavioral variable.
Practical Target Setting
A long-horizon investor (20+ years, 80% equities) targeting wealth accumulation should set a 7–9% nominal return target and measure quarterly against a risk-equivalent index. An income investor (retired, 60% bonds, 40% dividend stocks) should target 5–6% nominal with the priority being income stability over total return. Neither target is “better” — they are appropriate to different phases and risk tolerances.
When Is a Lower ROI Actually Acceptable?
Capital Preservation: The Phase That Requires a Different Benchmark
Near and in retirement, the goal shifts from wealth accumulation to wealth preservation. A 4–5% return in investment-grade bonds or dividend stocks is appropriate in this phase — not because the return is “good” in absolute terms, but because capital preservation and income reliability take priority over growth. Chasing equity returns late in the accumulation phase exposes the portfolio to sequence-of-returns risk: a 40% drawdown at age 62 does far more damage than the same drawdown at age 35 because there is less time to recover.
Dividend Income vs. Total Return
A 4% dividend yield from a company growing its dividend at 6% annually may outperform a 10% nominal growth stock on a risk-adjusted, after-tax basis for an income-focused investor. Qualified dividends are taxed at 15–20% for most investors; short-term capital gains are taxed at ordinary income rates up to 37%. The tax drag on high-turnover growth strategies is a legitimate reason to accept a nominally lower gross return from a dividend-focused approach.
The Core/Satellite Framework
ATGL advocates a core/satellite portfolio construction: a passive, low-cost ETF core targeting benchmark returns (the S&P 500 at 7–10% nominal), paired with an active, rules-based satellite designed to capture asymmetric opportunities. The core stabilizes the overall portfolio return toward the benchmark. The satellite — where ATGL’s stock picks and technical signals operate — is where the active return premium is sought. This structure allows a lower nominal target for the combined portfolio relative to the satellite alone, because the core absorbs much of the volatility.
When a ‘Good’ ROI Is Not Enough: The Failure Conditions
Tax Efficiency Failure
A 15% nominal gain on a short-term position (held under 12 months) taxed at a 37% marginal rate becomes a 9.45% after-tax return. The same 15% gain on a long-term position taxed at 20% (qualified capital gains) yields 12%. Tax efficiency — maximizing after-tax return for a given level of risk — is the most underutilized ROI lever available to retail investors. A strategy that generates 12% pre-tax with high turnover can be structurally inferior to an 8% pre-tax strategy with low turnover and qualified dividend treatment.
Behavioral Failure: The Return You Do Not Capture
The most destructive ROI failure is not a losing strategy — it is a sound strategy abandoned at its worst moment. An investor who sold their S&P 500 index fund during the March 2020 drawdown (–34%) and re-entered six months later locked in a realized loss, then missed the 68% recovery over the following 12 months. The fund’s CAGR for the full period was positive; the investor’s realized CAGR was sharply negative. Rules-based systems — defined entry and exit criteria established before the trade — are the structural solution to behavioral failure. They eliminate the decision at the point of maximum emotion.
Time-Period Selection Bias
A strategy that returned 45% over the 14 months from October 2022 to December 2023 (S&P 500 recovery from bear-market lows) looks exceptional in isolation. Measured from January 2022 through December 2023 — the full cycle including the drawdown — the same index returned approximately 3% total. Any return claim that does not specify the start and end date, and whether those dates were market peaks or troughs, is potentially misleading. Always demand full-cycle return data: peak to peak, not trough to peak.
Conclusion
A good return on investment is not a single percentage — it is the return that beats inflation, matches the risk profile of your asset allocation, and is actually captured through disciplined execution rather than abandoned at the moment of maximum stress. For most equity investors, 7% real annually over the long term is the honest benchmark; for balanced or income-focused portfolios, the target is lower in nominal terms but appropriately matched to the risk taken.
The framework:
- 7% real (~10% nominal) is the equity benchmark for long-horizon investors via the S&P 500 long-run average
- 4–6% nominal is the bond benchmark; real returns are minimal after inflation
- 8–12% nominal is the real estate benchmark including appreciation and income, before costs and leverage
- Inflation-adjust every return before calling it “good” — nominal gains without this comparison are incomplete
- Risk-adjust with the Sharpe Ratio: two identical nominal returns can represent very different risk profiles
- Fee drag of 1% annually costs ~25% of terminal portfolio value over 30 years — minimize it
- Rules-based exit criteria protect realized returns from behavioral failure — define stops before the trade, not during the drawdown
- Measure over full market cycles (peak to peak), not cherry-picked windows, to accurately evaluate any strategy
| Start Building Smarter Returns With ATGL
At AboveTheGreenLine.com we give rules-based investors the complete framework for measuring, benchmarking, and improving their portfolio returns — including the risk-adjusted tools and active satellite strategy most investors never apply. Join us Above the Green Line. |
Frequently Asked Questions
Is 7% a good return on investment?
Yes — 7% annually after inflation is widely considered a good return for stock market investments, as it mirrors the S&P 500’s long-run inflation-adjusted average. For bonds or cash, 7% would be exceptional and would imply elevated credit or duration risk. The benchmark depends entirely on what you’re investing in and the risk you’re accepting. A 7% real return from a diversified equity index fund is a sensible, evidence-based long-term target for most individual investors.
What is a realistic return on investment?
Realistic annual returns are 7–10% for diversified stock portfolios (nominal), 4–6% for bonds, and 8–12% for real estate in favorable markets. After adjusting for inflation averaging approximately 3%, real returns are meaningfully lower. Most long-term investors should target returns that outpace inflation by at least 3–4 percentage points and match the risk profile of their chosen asset class — not the highest-returning asset class they can find.
What is considered a high return on investment?
Returns above 15% annually sustained over multi-year periods are considered high for diversified portfolios and typically come with elevated risk, concentration, or leverage. Concentrated single-stock positions, leveraged strategies, or real estate development projects can achieve these returns in favorable conditions. Before calling any return “high,” verify the benchmark used, the time period selected (peak-to-peak vs. trough-to-peak), and the risk taken to generate it — all three variables dramatically change the assessment.
How do you calculate return on investment?
ROI = (Current Value – Cost of Investment) ÷ Cost of Investment × 100. For a $10,000 investment that grew to $11,500, ROI = ($11,500 – $10,000) ÷ $10,000 × 100 = 15%. For multi-year periods, use the annualized ROI formula (CAGR): (Ending Value ÷ Beginning Value)^(1 ÷ Years) – 1. Always subtract fees, taxes, and inflation from your gross return figure to arrive at the real, after-cost return that reflects your actual wealth creation.