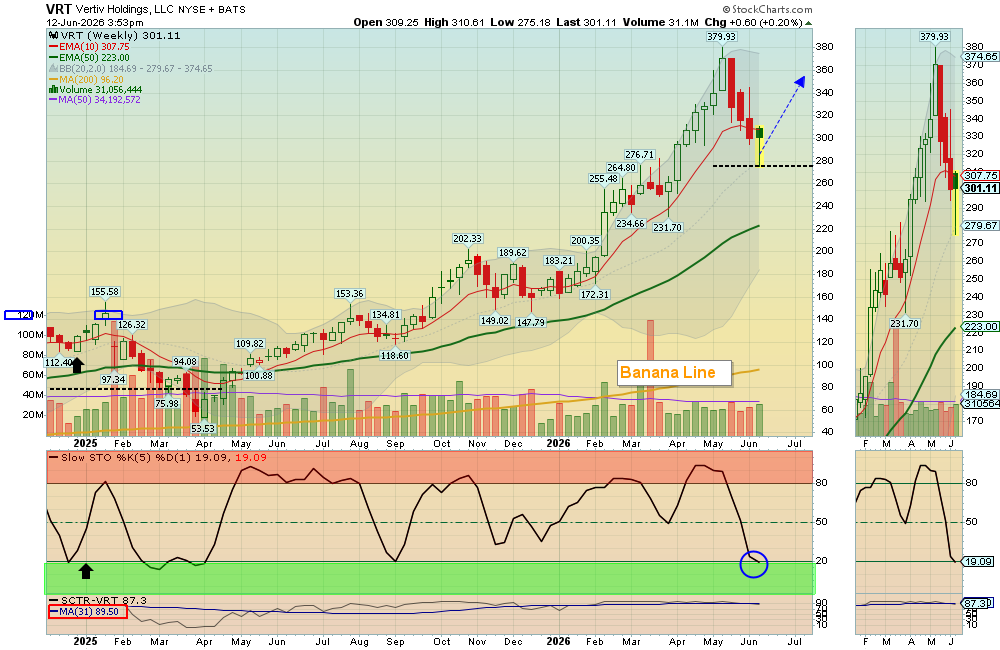
For busy investors that don’t have time to Swing Trade, we now have a simple Strategy:
Top Pick of the Week. You Buy the “Pick” on Monday morning, and then Sell on Friday’s Close. It’s a time-efficient approach designed to capture short-term gains without requiring constant market monitoring.
This “Pick” is emailed to you with this Weekly Commentary (see Top Pick below & more details here).
The Top Pick of the Week is still: Vertiv Holdings $VRT was able to bounce up this week, so we Held it and will Sell on the Close this Friday. The Weekly Chart should have a Weekly Buy Signal soon. Also $RDW Redwire Corp for an alternative TPOW.
You can view the superior Weekly Stock Performance.
______________________________________________________________________________
DAILY SWING TRADING (SHORT TERM)Watch List and Charts to Buy Soon.
| Daily Swing Watch List to Buy | Daily Swing Charts to Buy |
| Current Daily Swing Positions | Current Swing Charts |
| Closed Daily Swing Results | Trading Dashboard |
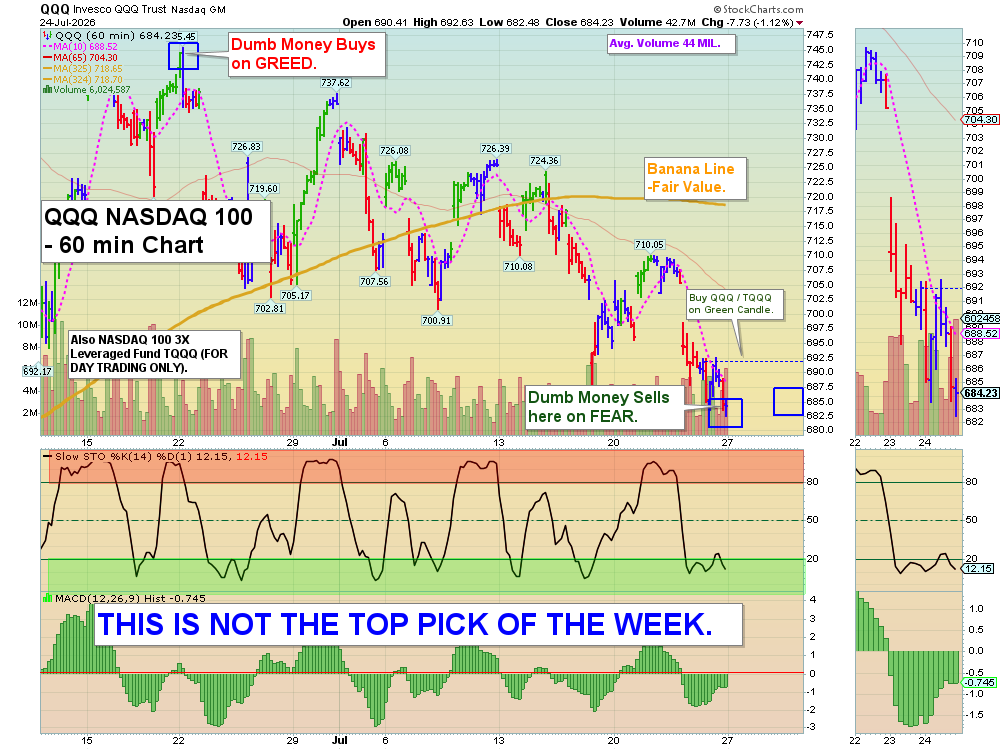
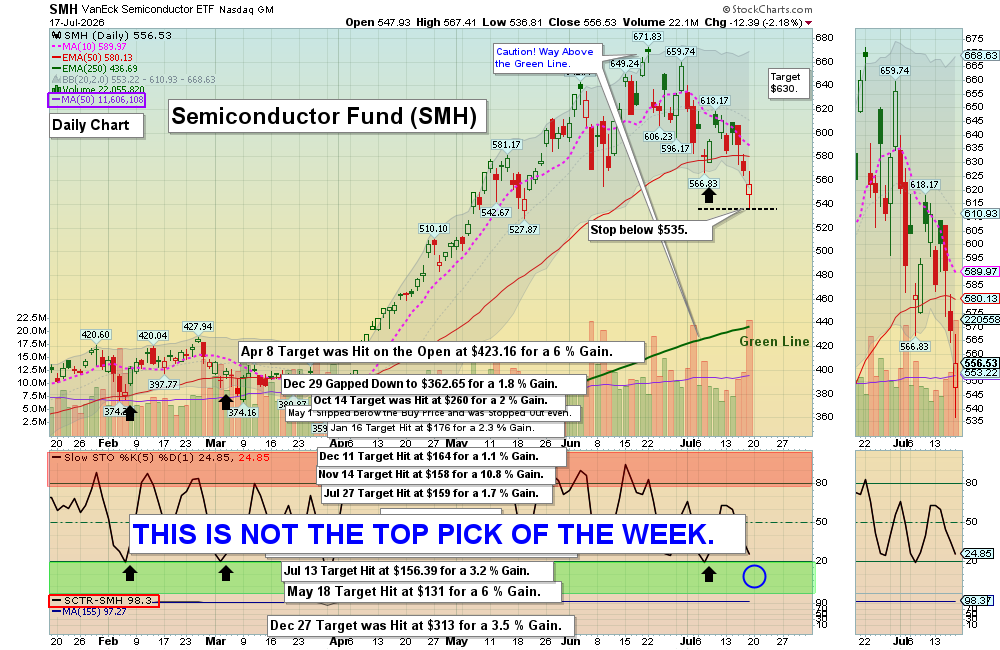
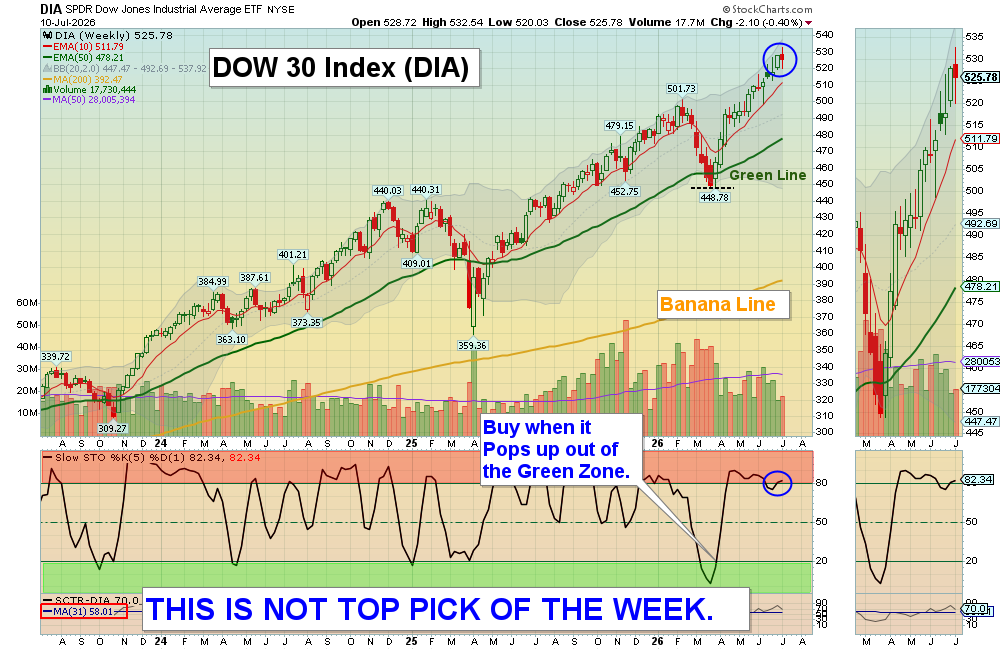
6/14/2026 Markets were higher for the week, aa the Tech / AI Stocks bounced back up to retest the recent highs. The major indices are bouncing up out of the Green Zones (probably too late to Sell for the short term). Now the Strongest Leaders should go back up to retest the recent highs. Failure to make higher highs could cause deeper Selling.
The Semiconductor Index / AI stocks are having a historic Buying Climax and Short Squeeze that had not been seen since the Internet Bubble in 1999.
SEE WATCH LIST If you follow the Green Line System and you should continue to win more than you lose.
With the Green Line System, your Money should flow into the Strongest areas and your Account value should be able to grow in both Bull and Bear Markets. Follow the MONEY, not the MEDIA.
______________________________________________________________________________
For the week the Dow was up 0.66%, the S&P 500 was up 0.65% and the NASDAQ 100 was up 2,31%. Try to own the stronger Funds here.
The Inflation Index (CRB) was down 2.00% this week and is Above the Green Line, indicating Economic Expansion.
Bonds were up 0.83% for the week, and are Above the Green Line, indicating Economic Contraction.
The US DOLLAR was down 0.26% for the week.
Crude Oil was down 6.92% for the week at $84.27 and GOLD was down 2.60% at $4218.23.
_______________________________________________________________________
DAY TRADERS: We are doing many profitable Day Trades at our Live Trading Room on YouTube during Market hours. Please join Discord or X (Twitter) with your cell phone app for the fastest Trade Alerts and Daily email notifications during the day. Other methods of notification have been too slow.
_______________________________________________________________________
COMPLETED DAILY SWING TRADES:
INTC Intel Corp. Sold at break even.
We are now in 1 Three Star logged Swing Trading Positions for the Short Term. There are 2 investments on the Short Term Watch List.
Completed Swing Trades in 2025: 243 Trades, or 3.2% Avg. / Trade (before taxes and commissions). ______________________________________________________________________________
WEEKLY SWING TRADES – WATCH LIST
Watchlist is for Members Only
There are currently <strong>7</strong> investments on deck to be purchased, based on our Daily Swing Trading strategy.
| ✅ Every stock currently on deck | ✅ Real-time SCTR and price data |
| ✅ Daily % change tracking | ✅ Entry criteria and comments for each pick |
|
Already a Member? 🔒 LOG IN → |
Not a Member Yet? VIEW MEMBERSHIP PLANS → |
Current Watchlist (Preview)
Become a member to see exactly which stocks are on deck and why.
| Open Date | Symbol | Description | SCTR | Last Price | Daily Change % | Comments |
|---|---|---|---|---|---|---|
| 🔒 | 🔒 | 🔒 | 🔒 | 🔒 | 🔒 | Members Only |
| 🔒 | 🔒 | 🔒 | 🔒 | 🔒 | 🔒 | Members Only |
| 🔒 | 🔒 | 🔒 | 🔒 | 🔒 | 🔒 | Members Only |
| 🔒 | 🔒 | 🔒 | 🔒 | 🔒 | 🔒 | Members Only |
| 🔒 | 🔒 | 🔒 | 🔒 | 🔒 | 🔒 | Members Only |
| 🔒 | 🔒 | 🔒 | 🔒 | 🔒 | 🔒 | Members Only |
| 🔒 | 🔒 | 🔒 | 🔒 | 🔒 | 🔒 | Members Only |
⭐ Join today to see our full watchlist and get alerted the moment we buy.
BECOME A MEMBER →Past performance is not indicative of future results.
Weekly Swing Trade Pops soon – Click here for scrolling charts.
WEEKLY SWING TRADES NONE THIS WEEK
Completed Weekly Swing Trades in 2025: 44 Trades, or 16 % / Trade (before taxes & commissions).
______________________________________________________________________________
Important Links| Top 100 | Stage Chart Investing | CNN Fear & Greed Index |
| Dividend Growth Portfolio | ETF Sector Portfolio | Dogs of the Dow |
| Long Term Strategy | Stage Chart Investing | Articles |
Alert! Market Risk is MEDIUM (Yellow). The probability of successful Short Term Trades is better, when the % of stocks above the 50-day avg. is below 20.
Tell your Friends about the Green Line, and Help Animals.
______________________________________________________________________________
QUESTION: Peter W. writes “When you say the RSI should be “ABOVE 90 RSI “. I look at your chart and it shows SCTR 90, not RSI. Please clarify.
ANSWER: Hi Peter. We don’t use RSI, which is a technical oscillator. We use the Relative Strength compared to the Market:
Q: Where do I find the Relative Strength Factor in StockCharts.com so I can add it to my charts?
A: Relative Strength Values comes from the SCTR Rank (StockCharts Technical Rank), and Investor’s Business Daily (IBD) or MarketInOut.com for stocks. We prefer the longer term weighting used by MarketInOut and IBD. We sometimes use a 155-day avg. of StockCharts SCTR, which is at the bottom left of many charts (just below the SCTR Rank) to simulate R S closer to the longer term ranking of IBD ranking.
Good trading, and tell your friends!
ATGL