By Andrew Stowers
Updated May 25, 2026
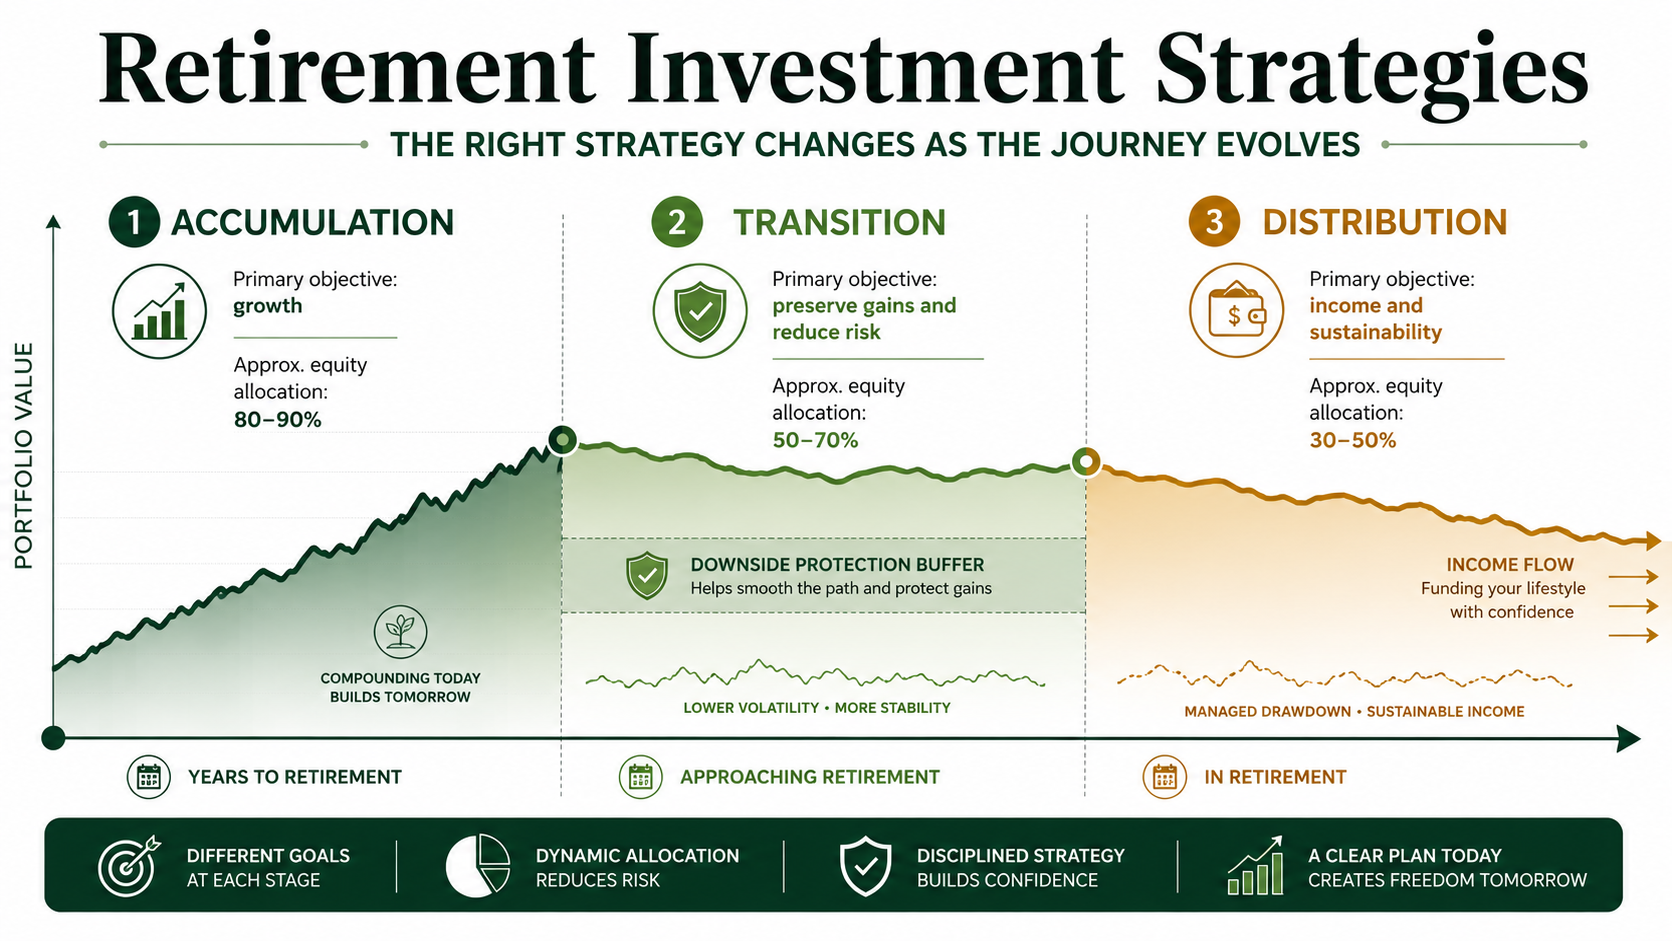
Retirement investing is not a single strategy you set in your 30s and maintain unchanged until you stop working. It is three fundamentally different strategies, each appropriate to a different phase of the journey.
The accumulation phase, where maximising growth and compounding is the priority. The transition phase, where protecting accumulated wealth while preparing for income becomes critical. And the distribution phase, where sustaining the portfolio for 20-30 years of withdrawals requires a different framework entirely.
Getting each phase right matters. Applying the wrong strategy to the wrong phase — being too conservative in accumulation, or staying too aggressive into distribution — is one of the most common and costly retirement planning failures. This guide provides the complete phase-by-phase framework. For more information about investments strategies suitable for whatever your circumstances may be, we think you’d enjoy reviewing our Investment Strategies Guide.
The Three Phases of Retirement Investing — and Why Each Requires a Different Strategy
Most generic retirement advice treats investing as a single, unchanging activity: diversify, stay invested, repeat. The reality is more nuanced. The primary investment objective, appropriate risk level, and most important risk to manage all change fundamentally as you move through the three phases.
| Phase | Time Horizon | Primary Objective | Approx. Equity % | Primary Risk |
|---|---|---|---|---|
| Accumulation (Early) | 25+ years to retire | Maximize compound growth | 85-95% | Being too conservative |
| Accumulation (Mid) | 15-25 years | Sustain growth, begin diversifying | 75-85% | Concentration in one asset class |
| Transition | 5-15 years | Protect capital, prep for income | 50-70% | Excess volatility entering retirement |
| Distribution (Early) | 0-10 years retired | Income + sequence risk management | 40-60% | Sequence of returns risk |
| Distribution (Late) | 10+ years retired | Longevity + inflation protection | 30-50% | Portfolio depletion / inflation |
The most important observation in this table: the primary risk shifts completely between phases. In early accumulation, the risk is being too conservative — failing to build adequate capital. In distribution, the risk is excessive volatility in early withdrawal years — permanently damaging the portfolio base. The same equity-heavy portfolio that is optimal in accumulation is dangerous in early distribution.
Every retirement investment strategy decision should begin with the question: which phase am I in, and what does that phase require?
Phase 1: The Accumulation Phase — Building the Foundation
| The Core Principle
In accumulation, time is your primary risk management tool — not bonds. A 35-year-old with a bad year in the market continues contributing at lower prices, effectively averaging down. That same equity exposure entering retirement creates sequence of returns risk. The strategies that work in accumulation are meaningfully different from those that work in distribution. |
Equity Allocation in Accumulation
With 20+ years before retirement, an equity allocation of 75-90% is appropriate for most investors. Time absorbs volatility — the historical record shows that any 20-year period in U.S. equities has produced positive real returns. Bonds in accumulation serve as an emotional comfort tool more than a mathematical necessity; for investors who can psychologically tolerate drawdowns, the long-run mathematics favor higher equity allocation.
Tax-Advantaged Account Priority
The account contribution sequence matters enormously for long-run compounding:
- First: contribute to your 401(k) up to the full employer match — the match is an immediate 50-100% return
- Second: maximize your Roth IRA (if income eligible) — tax-free growth is particularly valuable over long accumulation periods
- Third: return to the 401(k) to the annual contribution limit
- Fourth: taxable brokerage account for additional investment beyond tax-advantaged limits
The Roth vs traditional IRA decision hinges on whether you expect to be in a higher or lower tax bracket in retirement. Younger, lower-income investors generally benefit from Roth; older, peak-income investors may benefit from traditional. Consult a tax professional for your specific situation.
The 25x Target
The accumulation goal: 25 times your expected annual retirement spending — the inverse of the 4% withdrawal rule. Example: planning to spend $80,000 per year in retirement, with $24,000 expected from Social Security = $56,000 needed from the portfolio annually × 25 = $1.4 million target. Pension income reduces the required portfolio by the same multiplier.
Dollar-Cost Averaging: The Accumulation Superpower
Regular contributions regardless of market conditions — monthly via payroll or automatic investment — implement dollar-cost averaging automatically. Bear markets during accumulation are not threats; they are opportunities. The same contribution buys more shares at lower prices, improving the average cost basis for all shares held. This mechanism is only available in accumulation — it is lost the moment distributions begin.
Phase 2: The Transition Phase — Protecting What You’ve Built
| The Transition Insight
The transition phase is the most underplanned segment of the retirement journey. Most investors swing abruptly from accumulation mode to retirement with no deliberate de-risking — then experience their first bear market as a retiree without the cash buffer or fixed income layer that would have protected them. |
The transition phase — approximately 5-15 years before your target retirement date — is when the investment priority shifts from maximizing growth to protecting accumulated wealth and preparing for income. Two strategies define this phase:
The Glide Path: Systematic De-Risking
Rather than a sudden shift from aggressive to conservative allocation, the transition calls for a gradual glide path reduction: reducing equity exposure by 1-3% per year as retirement approaches. Beginning at 80% equity 15 years out, stepping toward 55-65% equity at retirement entry. This systematic approach eliminates the timing risk of a large, sudden allocation change at the wrong moment.
The 2-3 Year Cash Buffer
This is the single most effective pre-retirement move most investors never make: building a reserve of 2-3 years of expected annual withdrawals in cash or short-term bonds before retirement begins. Purpose: in the early years of distribution, all withdrawals come from this buffer rather than the equity portfolio. If the market drops 30% in your first year of retirement, you spend from the cash buffer — allowing the equity portfolio to recover before selling any shares is required.
Without this buffer, a market decline in early retirement forces asset sales at depressed prices, permanently reducing the portfolio base. With the buffer, those early losses are paper losses that recover while you live on cash.
Shifting from Growth to Income
Begin transitioning a portion of equity holdings toward income-generating assets during the transition phase: dividend-focused ETFs, investment grade bond ETFs, and real estate investment trusts. The goal is that by retirement, meaningful portfolio income (dividends and interest) supplements withdrawals — reducing the amount that requires asset sales.
The Core/Satellite Approach: The Right Framework for Every Phase
The core/satellite portfolio approach reconciles the two dominant retirement investment philosophies — passive index investing and active management — without requiring a choice between them.
The Core: Passive, Low-Cost, and Compounding
The core — comprising 60-80% of the retirement portfolio — is built from low-cost broad market index ETFs: a U.S. total market or S&P 500 ETF, an international equity ETF, and a bond ETF as a stabilizing layer. The core provides reliable market return capture at the lowest possible cost.
The expense ratio advantage compounds dramatically. An S&P 500 ETF at 0.03% versus an actively managed mutual fund at 1.0% represents nearly 1% of annual return difference. On a $500,000 portfolio over 30 years at 7% gross return, that 0.97% difference is approximately $350,000 in foregone wealth — from fees alone. The passive core eliminates this drag.
The Satellite: Active, Rules-Based, and Purposeful
The satellite — 20-40% of the portfolio — is where active decision-making creates value beyond the passive core. In accumulation, the satellite might be tactical sector positions or actively managed ETFs targeting return enhancement. In transition, the satellite shifts toward dividend-focused strategies and duration management. In distribution, the satellite provides income generation and tactical risk reductiofn.
Phase-Appropriate Ratios
Accumulation: core 70-80%, satellite 20-30%. Transition: core 60-70%, satellite shifting toward income-generating fixed income and dividend strategies. Distribution: core 60-70%, satellite 30-40% focused on income and capital preservation. The ratio stays relatively stable; the satellite’s composition changes as the phase requires.
Sequence of Returns Risk: The Retirement-Specific Threat
| The Definition
Sequence of returns risk is the danger that the ORDER in which investment returns occur — not just their average — determines whether a retirement portfolio survives. Two portfolios with identical average returns over 20 years can have dramatically different ending balances if one experiences losses early in retirement and the other experiences them late. |
Why It Only Matters in Distribution
In accumulation, year-to-year return sequence is irrelevant — contributions continue regardless. A bad year simply means you’re buying at lower prices. In distribution, a bad year means you’re selling at lower prices to fund withdrawals. The capital sold at a loss is gone — it cannot compound its way back. The portfolio base is permanently smaller, even if subsequent returns are excellent.
A Concrete Example
Portfolio A and Portfolio B each start retirement with $1,000,000 and withdraw $50,000 per year (5%). Both achieve exactly 6% average annual returns over 20 years.
Portfolio A experiences -20%, -15%, -10% in years 1-3, then strong positive returns. By year 10, withdrawals have depleted a smaller-than-expected base; recovery is limited by continued withdrawals. The portfolio may be exhausted by year 17-18.
Portfolio B experiences the same returns in reverse — strong positive years first, the losses in years 18-20. With the same average return and same withdrawal rate over 20 years, Portfolio B still has $600,000+ remaining when Portfolio A is exhausted.
Identical average returns. Dramatically different outcomes. The sequence — not the average — is what matters in retirement.
Three Mitigation Strategies
Strategy 1 — The cash buffer: maintain 2-3 years of withdrawals in cash or short-term bonds. Draw from this buffer during market downturns. Allows the equity portfolio to recover before any selling is required.
Strategy 2 — Flexible withdrawals: reduce annual withdrawals by 10-20% during years when the portfolio has declined significantly (down 15%+). A temporary spending reduction of $8,000-$10,000 per year can extend portfolio longevity by 3-5 years.
Strategy 3 — Maintain the growth allocation: moving entirely to bonds or cash eliminates sequence risk but introduces longevity risk — insufficient growth to sustain a 25-30 year retirement against inflation. The equity component is essential even in distribution.
Phase 3: The Distribution Phase — Making Your Portfolio Last
The distribution phase presents the most complex investment challenge: generating reliable income, preserving capital for 20-30 years, and maintaining enough growth to combat inflation — simultaneously and without any single error being catastrophic.
The 4% Rule — and Its Real Limitations
The 4% rule, derived from the Trinity Study (Cooley, Hubbard, Walz, 1998), states that a retiree withdrawing 4% of portfolio value in year 1 — then adjusting that dollar amount for inflation annually — had historically high probability (90%+) of the portfolio surviving 30 years. It is a useful starting point, not a guarantee.
Honest limitation: the study used U.S. market data from the 1990s, a period of historically high equity and bond returns. In today’s lower-expected-return environment, many planners suggest 3-3.5% as a more conservative starting withdrawal rate, particularly for retirements expected to last 35+ years.
Dynamic Withdrawal: A More Resilient Approach
A simple improvement over the rigid 4% rule: in any year when the portfolio is down 15% or more from its prior peak, reduce withdrawals by 10-20% for that year. When the portfolio recovers above the prior peak, return to the normal withdrawal rate. This small flexibility — a temporary spending reduction — significantly extends portfolio longevity by reducing asset sales at the worst possible time.
Dividend Income: Withdrawals Without Selling
Building a dividend-focused component in the distribution portfolio creates income that does not require asset sales. A dividend received during a bear market is not affected by the share price decline — it is income generated from business operations, not from liquidating assets at depressed prices. A retirement portfolio generating 2-3% in dividend yield requires fewer asset sales to meet spending needs, reducing sequence of returns exposure.
Tax Location in Distribution
The sequence in which you draw from different account types matters for after-tax income. A common approach: draw from taxable brokerage accounts first (while allowing tax-advantaged accounts to continue compounding), then traditional IRA/401(k) as needed for ordinary income, and Roth IRA accounts last (no Required Minimum Distributions, fully tax-free). Roth conversions in low-income years before RMDs begin can reduce future mandatory distributions. Consult a tax professional for your specific situation.
The Role of Active, Rules-Based Strategies in Retirement
A purely passive portfolio in retirement has important virtues: low cost, maximum diversification, and no manager selection risk. It also has a limitation: no tactical flexibility. The satellite allocation addresses this without abandoning the passive core’s advantages.
What the Active Satellite Adds
In accumulation: the satellite can add return potential above the passive core through rules-based tactical strategies in trending markets.
In transition: the satellite shifts toward income-generating dividend strategies and duration management in the fixed income allocation.
In distribution: the satellite can tactically reduce equity exposure when market conditions deteriorate, generate enhanced income through dividend strategies, and provide the portfolio flexibility that a rigid passive allocation cannot offer.
The Rules-Based Requirement
The active satellite only adds value if it is systematic and rules-driven. Emotional overrides — abandoning a strategy because it underperformed last quarter, increasing risk because the market has been rising, reducing equity in a panic during a correction — convert a structural advantage into a liability. The same discipline that separates successful passive investors from unsuccessful ones applies to active strategies: the rules must be defined in advance and followed under pressure.
Risk Management Is More Critical in Retirement
The risk parameters for the retirement satellite must be more conservative than for a younger investor. A maximum drawdown of 20-25% in the satellite may be acceptable for an accumulation-phase investor. For a retiree where the satellite represents 20-30% of total net worth, the same drawdown is a 4-8% portfolio loss — potentially meaningful in a sequence-sensitive distribution context. Explicit position sizing limits, stop-loss disciplines, and drawdown triggers should be defined specifically for the retirement satellite.
The Framework in Full
Retirement investing succeeds or fails not on stock-picking ability or market timing — it succeeds through having the right strategy for each phase of the journey, applied consistently, adapted as the phase changes.
The framework:
- Accumulation: high equity allocation, tax-advantaged account priority, 25x spending target, dollar-cost averaging as the compounding engine
- Transition: gradual de-risking glide path, 2-3 year cash buffer, shift toward income-generating assets
- Core/satellite: passive index core for compounding and cost efficiency, active satellite for income and tactical flexibility
- Sequence of returns: cash buffer, flexible withdrawals, and maintained growth allocation as the three mitigation tools
- Distribution: 3-4% initial withdrawal rate, dynamic adjustment, dividend income to reduce asset sales, tax-location sequencing
- Active satellite: rules-based and systematic, with conservative risk parameters appropriate to the retirement context
The investor who navigates each phase with a clear strategy — who is aggressive when time allows it and protective when sequence risk demands it — will have a better retirement outcome than the investor who is consistently moderate throughout.
| Build Your Complete Retirement Investment System With ATGL
At AboveTheGreenLine.com we give investors the rules-based framework for every phase of the retirement journey — from building the accumulation core to managing the distribution satellite with systematic discipline. Join us Above the Green Line and get the complete system. |
Frequently Asked Questions
What is the safest investment strategy for retirement?
The safest retirement investment strategy depends on your phase. In accumulation, ‘safe’ means capturing sufficient growth to build adequate capital — a portfolio too conservative in accumulation fails to reach retirement goals. In distribution, safety means protecting against sequence of returns risk and portfolio depletion — requiring a cash buffer, income-generating assets, and enough growth to combat inflation over a 20-30 year retirement. No single allocation is safest across all phases.
How much should I have invested by retirement?
A widely used guideline is 25 times your expected annual retirement spending — the inverse of the 4% rule. If you plan to spend $80,000 per year and expect $24,000 from Social Security, you need $56,000 per year from your portfolio. $56,000 × 25 = $1.4 million target. Pension income reduces the required portfolio by the same multiplier. Longer expected retirements or lower expected returns may require a higher multiple (28-33x).
What is the 4% rule for retirement?
The 4% rule, from the 1998 Trinity Study, states that a retiree withdrawing 4% of their portfolio in year 1 — then adjusting for inflation annually — had 90%+ historical probability of the portfolio lasting 30 years based on U.S. market data. In today’s environment, many planners recommend a more conservative 3-3.5% starting withdrawal rate for retirements expected to last 35+ years. The 4% rule is a useful starting point, not a guarantee.
What is sequence of returns risk in retirement?
Sequence of returns risk is the danger that poor investment returns early in retirement — when withdrawals have begun — permanently damage portfolio longevity, even if long-term average returns are healthy. Two retirees with identical portfolios, identical withdrawal rates, and identical 20-year average returns can have dramatically different ending balances if one experiences losses in early retirement and the other in later years. It is one of the most important retirement-specific risks and one of the most underplanned.

Related Articles
[pt_view id=”9b64b383ox”]