So far In 2026 the Top Pick Strategy had 10 trades totaling +30.2%, while the S&P 500 was down -5.1 %.
For busy investors that don’t have time to Swing Trade, we now have a simple Strategy:
Top Pick of the Week. You Buy the “Pick” on Monday morning, and then Sell on Friday’s Close. It’s a time-efficient approach designed to capture short-term gains without requiring constant market monitoring.
This “Pick” is emailed to you with this Weekly Commentary (see Pick below & more details here).
The Top Pick of the Week: Sandisk Corp. $SNDK will be bought on the Open Monday and Sold on the Close Friday.
You can view the superior Weekly Stock Performance.
______________________________________________________________________________
DAILY SWING TRADING (SHORT TERM)Watch List and Charts to Buy Soon.
| Daily Swing Watch List to Buy | Daily Swing Charts to Buy |
| Current Daily Swing Positions | Current Swing Charts |
| Closed Daily Swing Results | Trading Dashboard |
3/29/2026 Markets were sharply lower again for the week, as the Media has convinced the Herd that high Oil Prices will slow down the Economy. But the World demand for Oil has not increased, so the high Oil Price should drop, after this Media FEAR Flush is complete. The Indices are now very over-sold on the Weekly charts for Buy Signals soon. FEAR is High, and that is when we like to Buy.
The Strongest Stocks that are still above the 50-day averages should bounce up first: AMPX ASX COHR EWY MRNA PL & SNDK. Gold, Silver & Copper have finally had a large correction down to the Weekly Green Zones. The Magician / Media is scaring the Herd out again, to create Opportunity of Gains for those who Buy on FEAR with Smart Money.
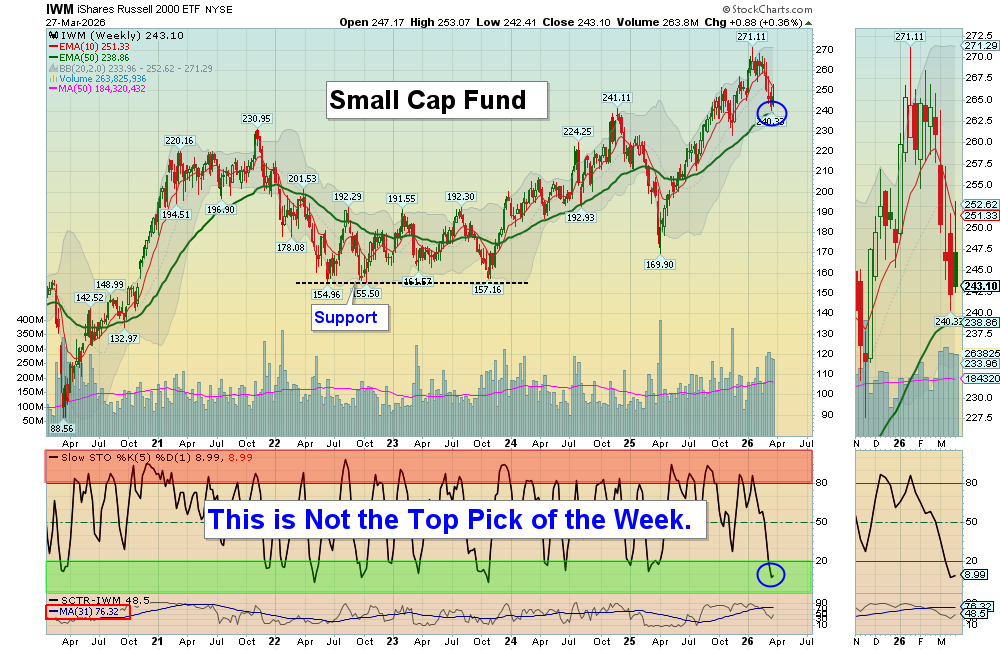
The major Stocks Indices are quickly back down to the Green Lines (like they always do) after the temporary Greed and FOMO (panic Buying) subsides. The S&P 500 CHART is back down into the Green Zone, which historically creates maybe a “Once a Year” Buying Opportunity. The Semiconductor Index (SOXX) is holding up the best of the non-Oil Indices, and should bounce first. We are not Selling Stocks now on this emotional FEAR Flush. Please Wait for Good News to Sell.
Dumb Money bought on Greed and Great News at the Stock Market Top in January. Now they are Selling on FEAR & Bad News to Smart Money. The Magician / Media does not teach the correct Rules of Investing, as someone has to be the LOSER. Can you be Smart Money?
We Buy the strongest Leaders that make new highs, on pull-backs. So follow the Green Line System and you should continue to win more than you lose. SEE WATCH LIST
With the Green Line System, your Money should flow into the Strongest areas and your Account value should be able to grow in both Bull and Bear Markets. Follow the MONEY, not the MEDIA.
______________________________________________________________________________
For the week the Dow was down 0.99%, the S&P 500 was down 2.12% and the NASDAQ 100 was down 3.22%. Try to own the stronger Funds here.
The Inflation Index (CRB) was up 0.49 % this week and is Above the Green Line, indicating Economic Expansion.
Bonds were down 0.22% for the week, and are Below the Green Line, indicating Economic Expansion.
The US DOLLAR was up 0.52% for the week.
Crude Oil was up 3.00 % for the week at $101.18 and GOLD was up 0.14% at $4495.05.
_______________________________________________________________________
DAY TRADERS: We are doing many profitable Day Trades at our Live Trading Room on YouTube during Market hours. Please join Discord or X (Twitter) with your cell phone app for the fastest Trade Alerts and Daily email notifications during the day. Other methods of notification have been too slow.
_______________________________________________________________________
COMPLETED DAILY SWING TRADES:
AAOI Applied Opto Sold via Trade Alert with a 11.36 % Gain.
ASTS AST Space Mobile Sold via Trade Alert with a 7.73 % Gain.
INTC Intel Corp. Slipped down to the Buy Price and stopped out even.
NAT Nordic Amer. Tankers Target was Hit with a 5.66 % Gain.
We are now in 1 Three Star logged Swing Trading Positions for the Short Term. There are 3 investments on the Short Term Watch List.
Completed Swing Trades in 2025: 243 Trades, or 3.2% Avg. / Trade (before taxes and commissions). ______________________________________________________________________________
WEEKLY SWING TRADES – WATCH LIST
| Open Date | Symbol | Description | Industry | SCTR | Size | Last Price | Daily Change % | ATGL 60 Min | Comments | id | Strategy | Position | Sell Date | Sell Price | Purchase Price | Net Profit | Realized Gain/Loss % | ATGL Rule | Stop Loss | color | Chart | Update Date | Status | Unrealized Gain/Loss % | Volume | Post Type | # Shares | Amount Invested | Portfolio Weight | Dividend Rate | Current Yield | Current Value | Yield on Cost | Projected Annual Dividends | Total Dividends Received | Pay Back | Profit / Loss | Annualized Profit/Loss | Star Rating | Target Price | News Alert % | Target Triggered |
|---|---|---|---|---|---|---|---|---|---|---|---|---|---|---|---|---|---|---|---|---|---|---|---|---|---|---|---|---|---|---|---|---|---|---|---|---|---|---|---|---|---|---|
| 2026-06-21 | CVE | Cenovus Energy | Energy | 84 | Mid | $24.85 | -3.4577 | Wait for next Weekly Money Wave Close > 20 with High Volume. | 5095 | Long Term | Long | $0.00 | 0.00% | https://stockcharts.com/sc3/ui/?s=CVE&a=1003009129&p=W&yr=1&mn=0&dy=0&id=p88523581588 | 2026-06-22 05:03:07 | open | 0.00% | 264679 | Watch List | $0 | 0.00% | 0.57 | 2.2991 | $0 | 0.00% | $0 | $0 | 0.00% | 0.00% | - | $29.00 | |||||||||||
| 2026-06-17 | USO | US Oil Fund | Energy | 92 | ETF | $106.43 | -4.3412 | Wait for next Weekly Money Wave Close > 20 with High Volume. | 5092 | Long Term | Long | $0.00 | 0.00% | https://stockcharts.com/sc3/ui/?s=USO&a=2293225295&p=W&yr=1&mn=6&dy=0&id=p78387113253 | 2026-06-18 15:54:20 | open | 0.00% | 1204555 | Watch List | $0 | 0.00% | 0.00 | 0 | $0 | 0.00% | $0 | $0 | 0.00% | 0.00% | - | $135.00 | |||||||||||
| 2026-06-07 | SLV | Silver Fund | Metals | 93 | ETF | $53.17 | -4.5936 | Wait for next Weekly Money Wave Close > 20 with High Volume. | 5083 | Long Term | Long | $0.00 | 0.00% | https://stockcharts.com/sc3/ui/?s=SLV&a=2284537971&p=W&yr=1&mn=6&dy=0&id=p52385594523 | 2026-06-08 19:47:29 | open | 0.00% | 5837800 | Watch List | $0 | 0.00% | 0.00 | 0 | $0 | 0.00% | $0 | $0 | 0.00% | 0.00% | - | $80.00 | |||||||||||
| 2026-05-26 | CTMX | Cytomx Thera. | HealthCare | 83 | Small | $3.25 | 3.0159 | Wait for next Weekly Money Wave Close > 20 with High Volume. | 5071 | Long Term | Long | $0.00 | 0.00% | https://stockcharts.com/sc3/ui/?s=CTMX&a=2273899296&p=W&yr=1&mn=0&dy=0&id=p89336138870 | 2026-05-26 19:08:23 | open | 0.00% | 83746 | Watch List | $0 | 0.00% | 0.00 | 0 | $0 | 0.00% | $0 | $0 | 0.00% | 0.00% | - | $5.50 |
Weekly Swing Trade Pops soon – Click here for scrolling charts.
WEEKLY SWING TRADES
ARWR Arrowhead Pharma. Weekly Swing Trade Buy, Target is $68.
GOOGL Alphabet Inc. Weekly Swing Trade Buy, Target is $335.
Completed Weekly Swing Trades in 2025: 44 Trades, or 16 % / Trade (before taxes & commissions).
______________________________________________________________________________
Important Links| Top 100 | Stage Chart Investing | CNN Fear & Greed Index |
| Dividend Growth Portfolio | ETF Sector Portfolio | Dogs of the Dow |
| Long Term Strategy | Stage Chart Investing | Articles |
Alert! Market Risk is LOW (Green). The probability of successful Short Term Trades is better, when the % of stocks above the 50-day avg. is below 20.
Tell your Friends about the Green Line, and Help Animals.
______________________________________________________________________________
QUESTION: Winter writes ““Don’t take a Loss” confuses me. What does that mean?”
ANSWER: When the Investment has a Money Wave Buy Signal, it should pop up 3-6 % in just a few days.
If it is not popping up well, and the Money Wave > 50, either Get Out, or Don’t Take a Loss!
Something must be Wrong. There will be plenty more… Raise Cash, and don’t get Stuck! Wait for the next one.
Good trading and tell your friends!
ATGL