The Investor’s Guide to Dividend Safety
By ATGL
Updated February 18, 2026
In the world of income investing, there is a common siren song: the high dividend yield. For many investors, a yield of 8%, 10%, or even 15% acts as a powerful lure, promising immediate cash flow and a shortcut to financial freedom. However, history is littered with the portfolios of investors who chased yield without understanding the engine behind it.
As outlined in our comprehensive Dividend Growth Master Guide, sustainable income investing is not built on headline yield alone, but on disciplined evaluation of earnings durability, free cash flow coverage, balance sheet strength, and long-term capital allocation strategy. Yield is the outcome of a healthy business model — not the strategy itself.
The single most important metric in determining whether a dividend is a promise or a ticking time bomb is the Dividend Payout Ratio. This article serves as a foundational deep dive into payout ratio analysis, its sector-specific nuances, and how it functions as a primary barometer of dividend sustainability within a disciplined dividend growth framework.
Defining the Core Concept: What is the Payout Ratio?
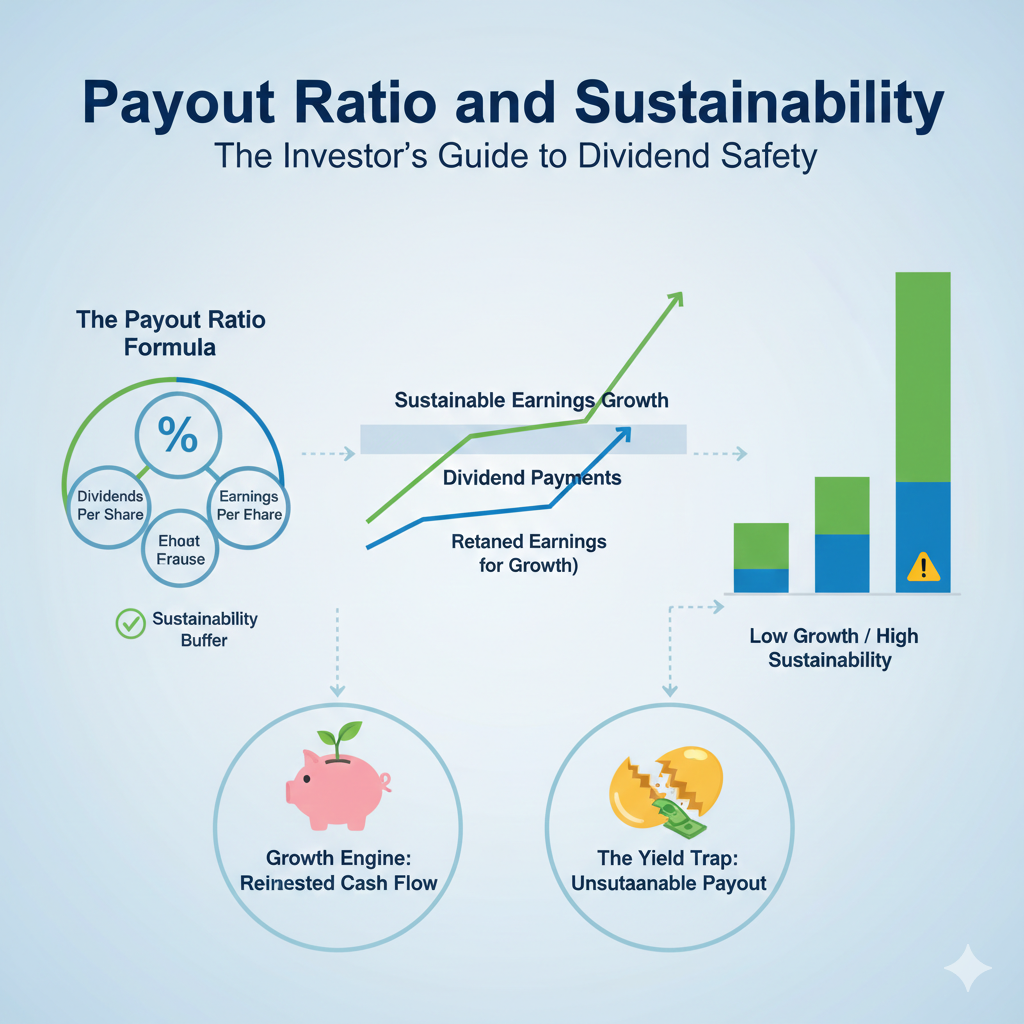
At its most fundamental level, the payout ratio is a measurement of how much of a company’s earnings are distributed to shareholders in the form of dividends, compared to how much is retained by the company to reinvest in its operations, pay down debt, or bolster the balance sheet.
The Basic Formula
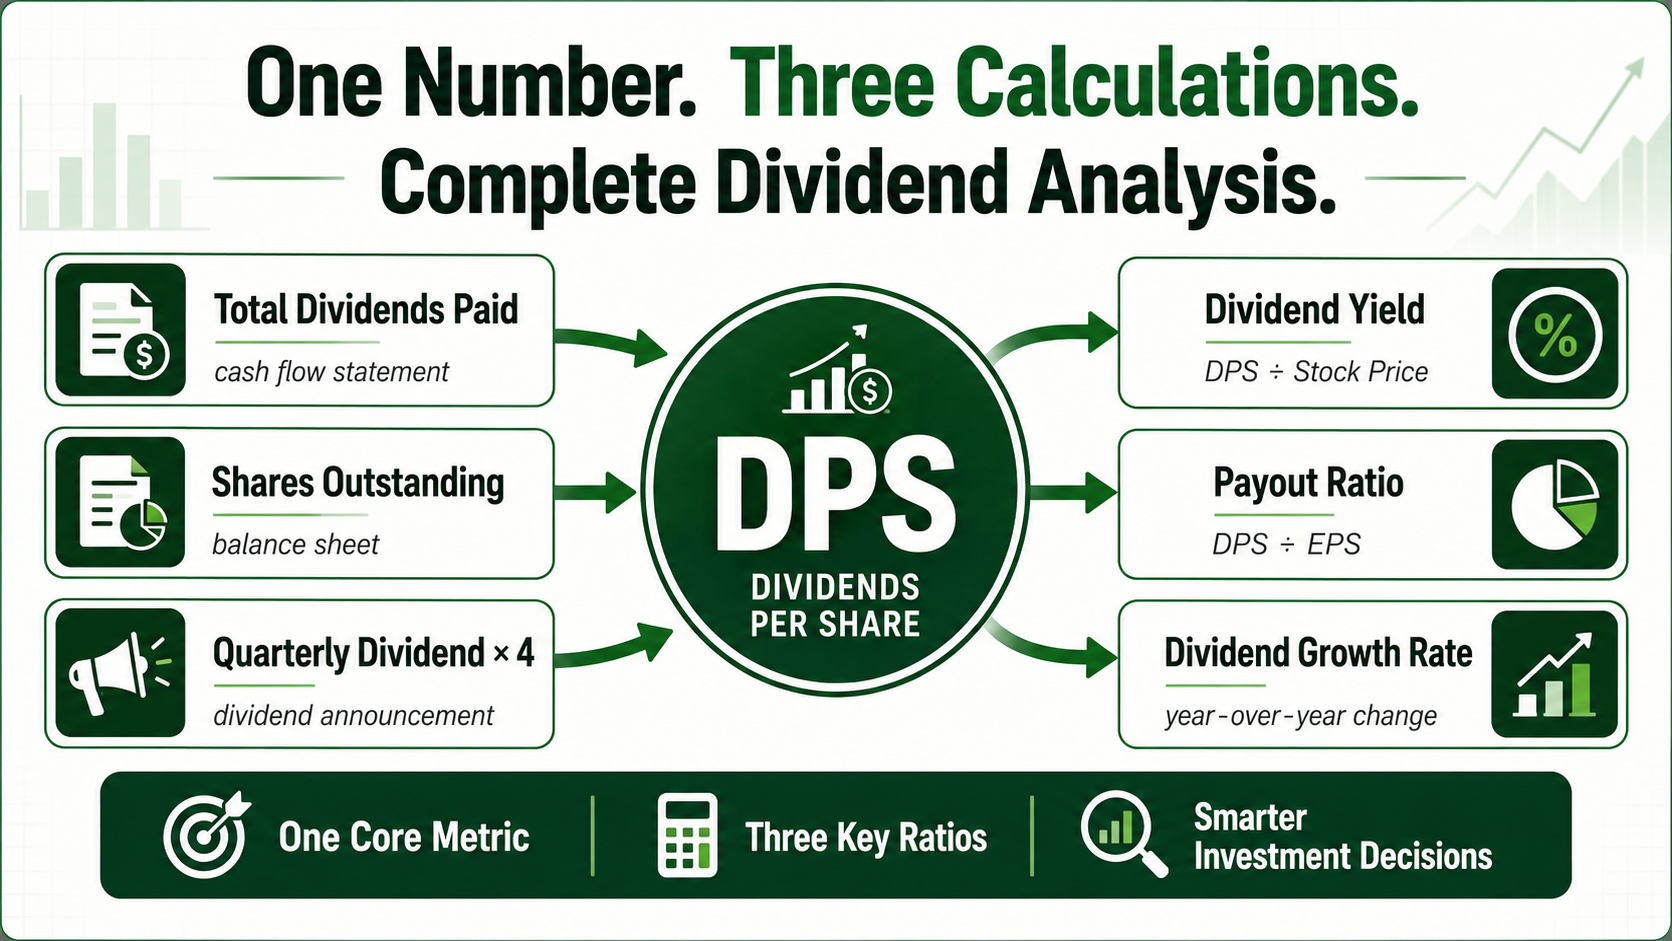
The most common way to calculate the payout ratio is by using Net Income (Earnings Per Share):
$$Payout\ Ratio = \frac{Dividends\ Per\ Share\ (DPS)}{Earnings\ Per\ Share\ (EPS)}$$
For example, if a company earns $5.00 per share over a fiscal year and pays out $2.00 in dividends, its payout ratio is 40%. This means the company is returning 40% of its profits to shareholders and keeping 60% to run the business.
Why It Matters
The payout ratio is the “margin of safety” for an income investor. A low payout ratio suggests that even if the company hits a rough patch and earnings decline temporarily, the dividend can still be paid. A high payout ratio suggests that the company is “stretched thin,” leaving no room for error.
The Spectrum of Sustainability: What is a “Good” Ratio?
There is no universal “perfect” payout ratio. The appropriate level depends on a company’s growth stage, capital intensity, and industry dynamics. However, broad benchmarks can help investors frame what is generally sustainable versus what may signal risk.
A payout ratio between 0% and 35% is typically associated with companies in earlier growth phases or those taking a highly conservative approach to capital allocation. These firms retain the majority of earnings to reinvest in expansion, research, or debt reduction. While this range offers substantial room for future dividend increases and a wide margin of safety, income-focused investors may view the current yield as insufficient.
The range of 35% to 60% is often considered the “sweet spot” for established dividend growers. Companies in this band balance shareholder distributions with reinvestment needs, supporting both current income and long-term earnings growth. This is common among mature, high-quality businesses with steady cash flow. Even within this favorable range, however, sustainability depends on consistent earnings performance and disciplined capital management.
When the payout ratio rises to 60% to 80%, the margin of safety begins to narrow. This level often reflects a maturing business with fewer reinvestment opportunities and slower growth. While investors may benefit from higher current income, even a modest earnings decline can quickly push the ratio toward unsustainable territory.
A payout ratio above 80% enters a danger zone for most traditional corporations. At this level, nearly all profits are being distributed, leaving minimal buffer against economic downturns or operational setbacks. Unless the company operates under a specialized structure—such as a REIT with mandated distribution requirements—an elevated payout ratio often indicates heightened vulnerability and limited flexibility. The key is not to search for a single “correct” number, but to understand where a company sits within its lifecycle and whether its payout ratio aligns with its growth prospects, capital needs, and cash flow stability.
Sector Nuances: Why “100%” Isn’t Always a Red Flag
Context is everything. If you apply a standard 60% limit to every stock, you would miss out on some of the best income-producing assets in the market.
Real Estate Investment Trusts (REITs)
REITs are legally required to distribute at least 90% of their taxable income to shareholders. Furthermore, they use Funds From Operations (FFO) instead of Net Income because depreciation (a non-cash expense) artificially lowers their EPS.
- Sustainable Ratio: Often 70%–90% of FFO.
Master Limited Partnerships (MLPs)
MLPs, common in the energy infrastructure sector, focus on Distributable Cash Flow (DCF). Because they have massive infrastructure assets that depreciate over decades, their net income rarely reflects the actual cash they have available to pay dividends.
Utilities
Regulated utilities have very predictable, recession-resistant cash flows. Because their business is so stable, they can safely maintain payout ratios in the 70% range without alarming the market.
Cash is King: Payout Ratio vs. Free Cash Flow (FCF)
One of the most dangerous mistakes an investor can make is relying solely on the EPS-based payout ratio. Earnings are an accounting construct; dividends are paid with cold, hard cash.
The FCF Payout Ratio
The Free Cash Flow Payout Ratio is often a much more accurate measure of sustainability. Free Cash Flow is the cash left over after a company has paid all its operating expenses and capital expenditures (CAPEX).
$$FCF\ Payout\ Ratio = \frac{Total\ Dividends\ Paid}{Free\ Cash\ Flow}$$
If a company’s EPS-based payout ratio looks healthy (40%), but its FCF-based payout ratio is 110%, it means the company is likely borrowing money or selling assets to pay that dividend. This is a massive red flag.
Technical Nuances: GAAP vs. Non-GAAP Payouts
To truly understand sustainability at a foundational level, an investor must look beneath the surface of reported earnings. Generally Accepted Accounting Principles (GAAP) often require companies to include non-cash charges that can distort the payout ratio.
Identifying One-Time Charges
A company might report a massive “loss” on paper due to a goodwill impairment or a legal settlement. This can cause the EPS to drop to near zero or even become negative, making the payout ratio look infinite (e.g., -500%). In these cases, the dividend might still be perfectly safe because the “loss” didn’t involve any cash leaving the bank account.
Adjusted Earnings (Non-GAAP)
Experienced investors often use “Adjusted Earnings” to calculate the payout ratio. This removes the “noise” of one-time events to show the company’s core earning power. However, be wary: management teams sometimes exclude legitimate recurring costs to make their payout ratio look better than it is. For investors seeking a simpler comparative lens that avoids some accounting complexity, analysts often turn to an inverse metric that presents sustainability as a coverage multiple rather than a percentage.
The “Dividend Coverage Ratio” Alternative
While the payout ratio is the most popular metric, many professional analysts prefer the Dividend Coverage Ratio. It is simply the inverse of the payout ratio.
$$Coverage\ Ratio = \frac{Earnings\ Per\ Share}{Dividends\ Per\ Share}$$
A coverage ratio of 2.0x is the same as a 50% payout ratio. Some find it easier to think in terms of “multiples.” A 3.0x coverage means the company earns three times what it pays out, providing a massive cushion for economic downturns.
The Lifecycle of a Dividend: From Growth to Maturity
Every company moves through a lifecycle, and its payout ratio typically evolves alongside that progression.
In the earliest stage, high-growth companies reinvest nearly all available capital back into the business. These firms often maintain a 0% payout ratio because expansion opportunities offer far higher returns than distributing cash to shareholders. For these companies, the question is not dividend sustainability but capital efficiency and opportunity cost.
As the business matures and cash generation begins to exceed reinvestment needs, management may initiate a dividend. At this stage, the payout ratio is usually modest—often in the 10% to 20% range—providing ample flexibility while signaling financial stability. The dividend becomes a supplement to growth rather than a primary capital return strategy.
In the next phase, the company enters its prime as a consistent dividend grower. Earnings are stable, competitive advantages are established, and cash flow visibility improves. Management raises the dividend regularly, and the payout ratio gradually rises into the 40% to 50% range. This balance between distribution and reinvestment is often the most sustainable period for long-term dividend compounding.
Eventually, growth opportunities slow and reinvestment yields decline. The business transitions into a mature, cash-generating enterprise. With fewer high-return expansion projects available, management returns a larger share of earnings to shareholders. Payout ratios in the 70% to 80% range become common. At this stage, the stock is valued more for income stability than for growth acceleration.
Understanding where a company sits along this lifecycle helps investors interpret its payout ratio correctly. A 20% payout ratio may signal immaturity in one context and strength in another. Sustainability depends not just on the number itself, but on the company’s stage of evolution and its remaining growth runway.
Case Study: The Anatomy of a Dividend Cut (The GE Example)
General Electric (GE) was once the gold standard of dividend safety. However, its downfall provides a masterclass in reading payout ratio warnings.
Leading up to its massive 2017 cut, GE’s GAAP payout ratio began to diverge wildly from its cash flow. While the “earnings” suggested the dividend was covered, the industrial free cash flow was plummeting. The company was essentially using its financial arm to mask the rot in its industrial core. When the FCF payout ratio exceeded 100%, the dividend’s fate was sealed.
Sector-Specific Benchmarks: A Comparative Guide
To avoid misjudging a stock, use this table as a reference for “normal” payout ratios across the 11 GICS sectors.
| Sector | Typical Sustainable Range | Why? |
|---|---|---|
| Technology | 20% – 40% | High need for R&D reinvestment. |
| Consumer Staples | 50% – 70% | Very stable demand; predictable cash flow. |
| Utilities | 65% – 85% | Regulated monopolies; high debt tolerance. |
| Financials | 30% – 45% | Subject to regulatory capital requirements. |
| Energy | 40% – 60% | Volatile; requires cushion for oil price drops. |
| REITs (FFO) | 75% – 95% | Tax-advantaged structure requires high payout. |
Macroeconomic Impacts on Sustainability
Sustainability is not just internal; it is external. Interest rate environments and inflation play a massive role.
The Interest Rate Squeeze
When interest rates rise, companies with high debt loads must spend more on interest payments. Since interest is paid before dividends, a rising rate environment can squeeze the payout ratio from the top down. This is particularly dangerous for “bond proxies” like Utilities and REITs.
Inflationary Pressure
If a company cannot pass on rising costs to its customers, its margins will shrink. As margins shrink, EPS falls, and the payout ratio rises—even if management doesn’t raise the dividend by a single penny.
Identifying a “Dividend Trap”
A dividend trap occurs when a high yield draws investors into a company whose underlying business is weakening. The yield appears attractive not because the dividend is growing, but because the stock price has fallen sharply. In these situations, the payout ratio often provides the earliest and most reliable warning.
The pattern typically begins with a deterioration in fundamentals. Revenue growth slows, margins compress, competitive pressures intensify, or debt levels begin to rise. Earnings decline, yet management keeps the dividend unchanged in an effort to preserve investor confidence.
As the stock price drops, the dividend yield rises mechanically. A 4% yield can quickly become 10% or more—not due to improved performance, but because the share price has fallen. Income-focused investors may interpret this as opportunity rather than risk.
Meanwhile, the payout ratio begins to expand. What was once a comfortable 50% ratio may climb above 80%, and in more severe cases, the dividend may exceed free cash flow entirely. When dividends are no longer supported by internally generated cash, companies often rely on borrowing or asset sales to maintain appearances. This financial strain quietly builds beneath the surface.
Eventually, the imbalance becomes unsustainable. Cash reserves shrink, leverage rises, and credit metrics weaken. At some point, management is forced to cut or eliminate the dividend to preserve the business. The market reaction is typically swift and severe, with another sharp decline in the stock price as income-driven investors exit.
Avoiding a dividend trap requires comparing the current payout ratio to its historical norm and confirming that dividends are consistently covered by free cash flow. A payout ratio that rises persistently while earnings and cash flow deteriorate is rarely a coincidence. In most cases, it is a leading indicator of future cuts.
A high yield is not necessarily a reward. Often, it is the market signaling that the business model is under stress. The disciplined investor focuses not on the headline yield, but on the sustainability behind it.
Psychological Sustainability: Management’s Commitment
While the numbers are vital, the “qualitative” side of sustainability matters too.
The Dividend Culture
Some companies, like the Dividend Aristocrats, view their dividend as a sacred contract. For these companies, cutting the dividend is a last resort that usually results in the firing of the CEO.
Investors should look for “Dividend Policy Statements” in annual reports. Management that explicitly states a target payout ratio (e.g., “We aim to maintain a payout ratio between 40% and 50%”) provides much-needed transparency and predictability.
International Considerations: Different Payout Cultures
Not all markets value the “slow and steady” increase favored in the United States.
The European Model
Many European companies pay dividends based on a fixed percentage of annual profits. This means if profits double, the dividend doubles; if profits drop 50%, the dividend is cut in half. In this culture, a “dividend cut” isn’t a sign of failure—it’s just a reflection of that year’s business cycle.
The Australian Model
Australia has a high-payout culture due to “franking credits” (tax benefits for shareholders). Payout ratios in Australia are often much higher than in the US, but are supported by different tax incentives that encourage cash distribution.
The Role of Share Buybacks in Sustainability
To understand the full scope of dividend sustainability, one must analyze Share Buybacks. Often, a company will pay a dividend and buy back its own shares simultaneously.
Total Shareholder Yield
While the payout ratio only looks at dividends, the “Total Shareholder Yield” includes buybacks. Buybacks act as a secondary “safety valve.” If a company hits financial trouble, it will almost always stop buying back shares before it cuts its dividend. Therefore, a company with a 50% dividend payout ratio and a massive buyback program is actually much safer than a company with a 50% payout ratio and no buybacks.
Reducing the Future Burden
Every share bought back is one less share management has to pay a dividend on in the future. In this way, a consistent buyback program actually lowers the future payout ratio over time, making the remaining dividends more sustainable.
Debt Covenants: The Invisible Boundary
A foundational understanding of sustainability requires looking at a company’s credit agreements. Debt covenants are legal restrictions placed on a company by its lenders (banks or bondholders).
Negative Covenants
Many debt agreements include clauses that strictly forbid a company from paying dividends if certain financial ratios (like Debt-to-EBITDA) exceed a specific limit. In these cases, even if a company has the cash to pay the dividend, they are legally prohibited from doing so.
Investors should check the “Risk Factors” or “Debt” section of a company’s 10-K filing to see if such restrictions exist. A rising payout ratio combined with a heavy debt load is the most common precursor to a “forced” dividend cut.
Capital Expenditure (CAPEX) Intensity
Sustainability is also a function of how much “maintenance” a business requires.
High-CAPEX vs. Asset-Light
A railroad or a steel mill must spend billions of dollars every year just to keep its tracks and furnaces in working order. This is called “Maintenance CAPEX.” If a company ignores this maintenance to keep its payout ratio low, it is “cannibalizing” its future. Eventually, the equipment will fail, earnings will vanish, and the dividend will disappear.
Conversely, “Asset-Light” businesses (like software companies) have very low maintenance costs, meaning their payout ratios are inherently more sustainable because more of their cash is “discretionary.”
The Impact of Corporate Taxation
Finally, we must consider the tax environment. Dividend policy is often driven by how the government taxes corporate distributions versus capital gains.
Double Taxation
In many jurisdictions, dividends are taxed at the corporate level and then again at the individual level. If tax rates on dividends rise, management might choose to lower the payout ratio and instead use that cash for buybacks or acquisitions to give shareholders “capital gains” instead of “income.”
The “Retained Earnings” Growth Formula
One of the most profound, yet overlooked, aspects of the payout ratio is its direct link to the Sustainable Growth Rate (SGR). This is a foundational mathematical principle in finance that tells you how fast a company can grow its earnings without having to borrow more money or issue new shares.
The Retention Ratio
The retention ratio is simply 1 minus the payout ratio. If a company has a 40% payout ratio, its retention ratio is 60%.
$$SGR = Retention\ Ratio \times Return\ on\ Equity\ (ROE)$$
This formula proves that the payout ratio is a double-edged sword. If management pays out too much (a 95% payout ratio), they only retain 5%. Even if they have a brilliant 20% ROE, their sustainable growth is capped at a meager 1% ($0.05 \times 0.20$). Thus, a payout ratio that is “too high” actually kills the long-term sustainability of the dividend by starving the business of growth capital.
Behavioral Finance: The “Sticky” Dividend
Lastly, we must understand the psychology of management. In finance, dividends are considered “sticky.”
The Signaling Effect
Management teams know that the market punishes dividend cuts with extreme prejudice. Therefore, they often treat the current dividend level as a “floor.” This leads to behavioral biases: management might keep a payout ratio at 110% for two years, hoping for a turnaround, rather than cutting it immediately.
For the investor, this means the payout ratio is a leading indicator, while the dividend cut itself is a lagging indicator. If you wait for the cut to sell, you have already lost. If you see the payout ratio rising sustainably above 80% (outside of specialized sectors), the behavioral “stickiness” of the dividend is merely buying you time to exit before the inevitable collapse.
Summary: Integrating the Payout Ratio into Your Strategy
The payout ratio is not a “buy” or “sell” signal in isolation. It is the analytical filter through which all other financial data must pass. When properly understood, it reveals whether a dividend is supported by durable earnings power or sustained by financial engineering.
By mastering the nuances of payout analysis — from GAAP distortions and free cash flow coverage to debt covenants and the Sustainable Growth Rate — investors move beyond yield chasing. They begin thinking like long-term business owners, focused on capital preservation, disciplined reinvestment, and sustainable compounding.
Payout ratio analysis does not replace a broader strategy. It strengthens it. Within dividend growth models, ETF allocation frameworks, and structured rules-based systems, it serves as a risk-control mechanism — helping investors avoid traps, manage volatility, and maintain income reliability across market cycles.
When you stop viewing dividends as a gift and start viewing them as a structured distribution of retained earnings, your investment process changes. You no longer react to yield spikes or headline noise. You evaluate financial strength, management discipline, and long-term sustainability.
That shift — from reactive income seeking to rules-based capital stewardship — is what separates durable wealth builders from temporary yield hunters.
Apply This Discipline with a Structured Framework
At Above the Green Line, we integrate dividend sustainability analysis into a broader rules-based investing system designed to reduce emotional decision-making and focus on high-probability setups. Whether evaluating dividend growth stocks, momentum leaders, or ETF allocations, every position must meet defined criteria — including financial strength and sustainability metrics.
If you want a structured approach that combines technical discipline with fundamental safeguards like payout ratio analysis, explore how our framework works.
👉 Join Above the Green Line and invest with rules, not reactions.
Make confident trading decisions with rules-based investing.
Final Cheat Sheet: The Sustainability Audit
| Factor | Healthy Sign | Red Flag |
|---|---|---|
| Earnings Payout | 30% – 60% | > 80% (Non-REIT) |
| FCF Payout | < 70% | > 100% |
| Debt Load | Low/Declining | High Interest/Strict Covenants |
| Buybacks | Consistent | Non-existent or fueled by debt |
| Capex | Fully funded maintenance | Maintenance deferred to pay dividends |

Related Articles
[pt_view id=”b47aec5l7b”]