By ATGL
Updated February 3, 2026
Smart traders know that the best investment opportunities often come from spotting trends before they hit mainstream economic reports. The international shipping index provides exactly this advantage, tracking freight costs across global trade routes to deliver early warnings about inflation spikes, commodity price movements, and sector rotations. When shipping rates surge, it frequently signals rising input costs and consumer demand months before these trends appear in corporate earnings or economic data, giving astute investors time to position themselves in the right sectors and adjust their portfolios for changing market dynamics.
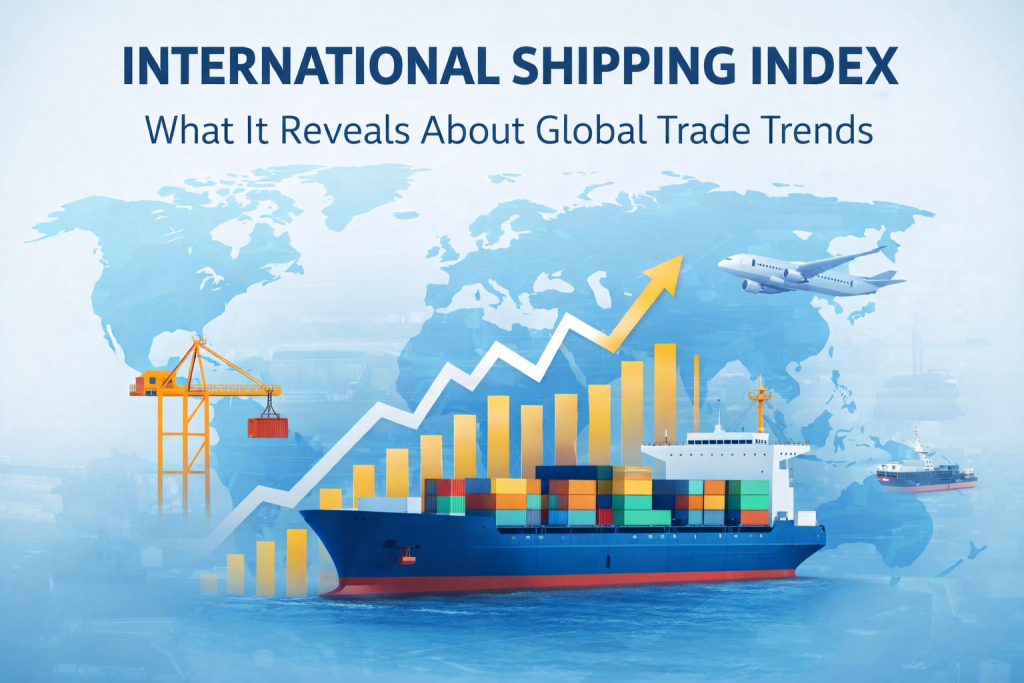
What Is an International Shipping Index?
An international shipping index measures the cost of transporting goods via ocean freight along specific trade routes. These indexes aggregate spot rates charged by shipping companies for various vessel types and cargo categories, creating standardized benchmarks that reflect supply and demand conditions in global maritime transportation.
The calculation methodology varies by index but typically involves weighted averages of freight rates across multiple routes. Key factors include vessel availability, port congestion, fuel costs, and seasonal demand fluctuations. Most indexes update weekly or daily, providing real-time visibility into shipping cost trends.
Several prominent indexes track different aspects of maritime transportation. The Baltic Dry Index (BDI) tracks bulk commodities such as iron ore, coal, and grain, making it particularly sensitive to industrial demand. The Shanghai Containerized Freight Index (SCFI) tracks container rates from Shanghai to major global destinations, while the Freightos Baltic Index (FBX) provides a global benchmark for 40-foot container spot rates. The Drewry World Container Index (WCI) offers a composite view by monitoring eight major routes connecting the United States, Europe, and Asia.
Why Shipping Rates Matter to Global Markets
Shipping costs directly impact the price of imported goods, creating ripple effects throughout the global economy. When freight rates increase significantly, companies face higher input costs, which often translate into higher consumer prices and contribute to inflationary pressures. Conversely, declining shipping costs can reduce production expenses and support deflationary trends.
The relationship between freight costs and trade volumes reveals underlying economic strength. Rising shipping rates combined with increasing cargo volumes typically signal robust consumer demand and economic expansion. This scenario often occurs when vessel capacity constraints meet strong import requirements, creating upward pressure on rates.
Low shipping rates, coupled with reduced cargo volumes, generally indicate economic weakness or oversupply. This combination suggests weakening consumer demand, reduced industrial activity, or an excess of available vessels relative to shipping requirements. Such conditions frequently precede or accompany economic slowdowns.
Port congestion and supply chain disruptions can artificially inflate shipping rates regardless of underlying demand conditions. Recent examples include disruptions to the Red Sea shipping route and pandemic-related port bottlenecks, which led to temporary rate spikes despite mixed economic signals.
How Traders Use Shipping Indexes as Leading Indicators
Experienced traders monitor shipping indexes to anticipate demand shifts before they appear in traditional economic data. Rising freight rates often precede increases in commodity prices, as higher transportation costs get passed through to end consumers. This relationship makes shipping indexes valuable for timing entries into commodity-related investments.
The Baltic Dry Index particularly attracts attention from traders focused on industrial metals, energy, and agricultural commodities. A sustained increase in the BDI typically signals growing demand for raw materials, suggesting potential strength in mining, steel, and construction-related sectors. Declining BDI readings often precede weakness in these same industries.
Container shipping indexes also provide insights into consumer goods demand and retail sector performance. Strong container rates from Asia to North American and European markets often indicate healthy consumer spending and retail inventory building. Weakening container rates may signal softening consumer demand or excess inventory conditions.
Traders also use shipping indexes to identify potential currency movements and emerging market opportunities. Strong shipping demand to specific regions often correlates with economic growth and currency strength in those areas. The Hang Seng Index (HSI) demonstrates this correlation, often rising alongside increased shipping rates on Asia-to-North America routes as higher freight costs reflect stronger trade volumes and economic momentum in the region.
Shipping Costs and Inflation Cycles
The transmission mechanism between shipping costs and consumer price inflation operates through multiple channels. Direct effects occur when higher freight rates increase the landed cost of imported goods, forcing retailers to raise prices to maintain margins. Indirect effects arise when transportation cost pressures affect domestic shipping rates and regional distribution costs.
Central banks monitor shipping indexes as part of their inflation analysis framework. Sustained increases in freight rates often appear in import price indexes before showing up in broader consumer price measurements. This lead time allows monetary policymakers to anticipate inflationary pressures and adjust policy stances accordingly.
The magnitude of shipping cost impacts on inflation depends on the economy’s openness to international trade. Countries with high import-to-GDP ratios experience more pronounced effects from shipping rate volatility than economies with greater domestic production capabilities.
Energy costs represent a significant component of shipping expenses, creating feedback loops between oil prices and freight rates. Rising crude oil prices increase vessel operating costs, pushing up shipping rates. These higher transportation costs then contribute to broader inflationary pressures, potentially affecting energy demand and prices.
What a Rising or Falling Index Tells You
Interpreting shipping index movements requires understanding the underlying drivers and market context. Rising indexes during periods of economic expansion typically indicate healthy demand growth and suggest continued economic strength. However, rapid increases may signal emerging supply chain bottlenecks or inflationary pressures that could prompt central bank intervention.
Falling shipping indexes during economic downturns often confirm weakening demand conditions and may signal opportunities for contrarian positioning. Extremely low freight rates can indicate oversupply conditions that may persist until vessel capacity adjusts through scrapping or reduced new construction.
Context matters significantly when analyzing shipping index movements. Rate increases driven by supply disruptions require different interpretations than those caused by demand growth. Similarly, declines in rates from new vessel deliveries differ from those caused by weakening economic conditions.
Seasonal patterns also influence shipping index interpretation. Container rates typically strengthen during pre-holiday shipping seasons, while bulk commodity rates often peak during harvest periods. Understanding these cyclical patterns helps traders distinguish between temporary fluctuations and meaningful trend changes.
Using Shipping Indexes With Other Market Signals
Successful trading strategies incorporate shipping indexes alongside complementary economic indicators to build comprehensive market views. Combining freight rate data with currency movements, commodity prices, and equity sector performance creates more robust analytical frameworks than relying on shipping indexes alone.
The MSCI World Index often correlates with global shipping activity, as international equity performance reflects underlying economic growth patterns. Divergences between shipping indexes and equity markets may signal emerging opportunities or provide early warning signs of trend reversals.
Currency relationships offer additional validation for shipping index signals. Strong shipping demand typically supports the currencies of exporting nations while pressuring importers’ currencies. These relationships can help traders identify optimal timing for international investments and currency hedging strategies.
Commodity markets provide natural complements to shipping index analysis. Rising freight rates often precede commodity price increases, while falling shipping costs may signal oversupply conditions in commodity markets. This relationship helps traders time entries into commodity-related investments and ETFs.
However, shipping indexes have limitations. These indicators primarily reflect short-term supply and demand imbalances rather than long-term economic trends. Additionally, disruptions, regulatory changes, and technological advances can distort traditional relationships between shipping costs and economic conditions.
Above the Green Line’s membership platform delivers a competitive edge by combining shipping index trends with comprehensive international trade report data, providing members with the analytical depth needed to spot high-probability opportunities before they become mainstream trades.

Related Articles

Understanding Market Microstructure for Better Trading Decisions

Understanding the Liquidity Trap and Its Impact on Investors

How Market Sentiment Indicators Can Influence Trading Decisions

How Government Shutdowns Can Affect Stock Markets and Trading Strategies