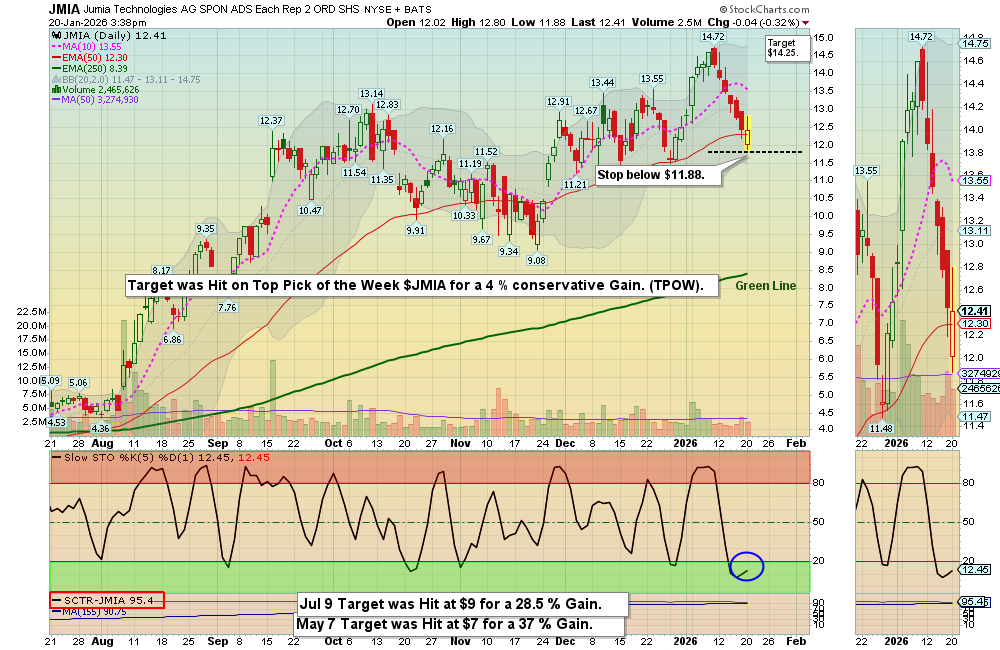
The Target was Hit on the Top Pick of the Week: $JMIA for a 4% conservative Gain.DAILY SWING TRADING (SHORT TERM)
Watch List and Charts to Buy Soon.
| Daily Swing Watch List to Buy | Daily Swing Charts to Buy |
| Current Daily Swing Positions | Current Swing Charts |
| Closed Daily Swing Results | Trading Dashboard |
Current Pick and Chart
| Top Pick of the Week | TPOW Stock Chart |
Top Pick of the Week: Jumia Technologies. $JMIA was bought at the Open today, and popped up nicely and was Sold for a Solid 4% gain (Conservative Target).
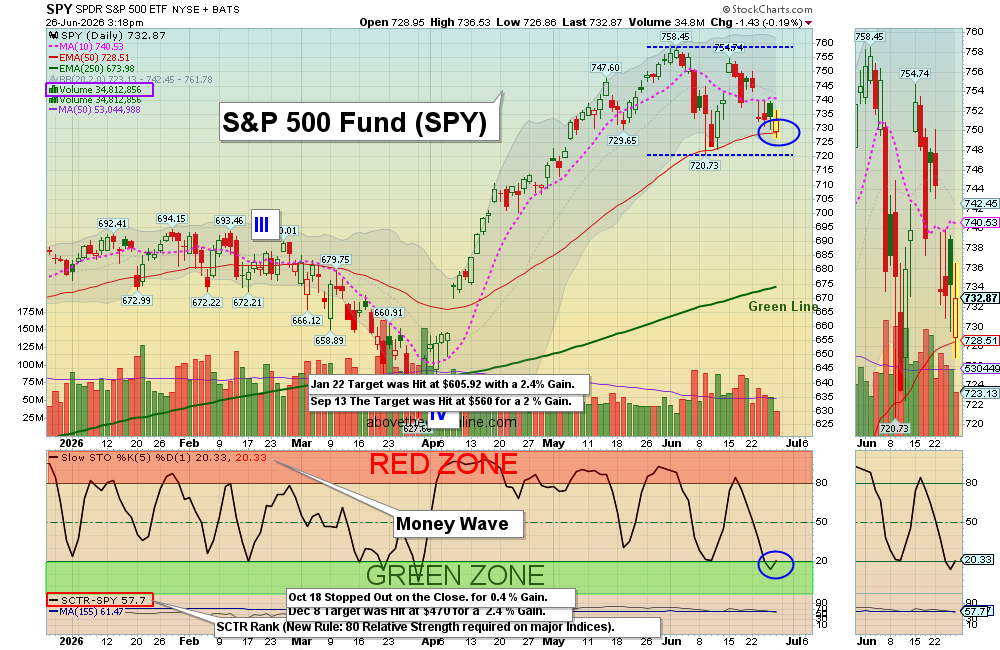
Jan 20, 2026 Today, Markets opened on a weaker note as SPY gapped down toward the 50-day average and attempted to stabilize at that level. Small caps via IWM tried to hold above the pink-line support, showing relative resilience, while natural gas (UNG) posted a strong upside move. At the same time, the greed index SVXY dropped sharply as the fear index UVXY moved higher, signaling a shift in sentiment.
We secured a solid 4% gain on our TPOW in JMIA on the pop up. The session overall remained weak despite strength in commodities and precious metals like Gold and Silver.
Wait for more Buy Signals coming up out of the Green Zones. WATCH LIST CHARTS
The best moves happen when the S&P 500 Index is also coming up out of the Green Zone.
______________________________________________________________________________
BUYS TODAY 01/20/2026 NONE TODAY
BUYS SOON
| Open Date | Symbol | Description | SCTR | Last Price | Daily Change % | Comments | ATGL 60 Min | id | Strategy | Position | Sell Date | Sell Price | Purchase Price | Net Profit | Realized Gain/Loss % | ATGL Rule | Industry | Size | Stop Loss | color | Chart | Update Date | Status | Unrealized Gain/Loss % | Volume | Post Type | # Shares | Amount Invested | Portfolio Weight | Dividend Rate | Current Yield | Current Value | Yield on Cost | Projected Annual Dividends | Total Dividends Received | Pay Back | Profit / Loss | Annualized Profit/Loss | Star Rating | Target Price | News Alert % | Target Triggered |
|---|---|---|---|---|---|---|---|---|---|---|---|---|---|---|---|---|---|---|---|---|---|---|---|---|---|---|---|---|---|---|---|---|---|---|---|---|---|---|---|---|---|---|
| 2026-06-25 | AXTI | Amer. Xtal Tech. | 99 | $70.15 | 1.5783 | Wait for next Daily Money Wave Close > 20 with High Volume. | 5100 | Short Term | Long | $0.00 | 0.00% | Semiconductor | Small | https://stockcharts.com/sc3/ui/?s=AXTI&a=2165396946&p=D&yr=0&mn=4&dy=0&id=p21116263806 | 2026-06-25 20:31:10 | open | 0.00% | 16880744 | Watch List | $0 | 0.00% | 0.00 | 0 | $0 | 0.00% | $0 | $0 | 0.00% | 0.00% | - | $105.00 | |||||||||||
| 2026-06-24 | MRVL | Marvell Tech. | 99 | $266.77 | -5.1518 | Wait for next Daily Money Wave Close > 20 with High Volume. | 5099 | Short Term | Long | $0.00 | 0.00% | Semiconductor | Large | https://stockcharts.com/sc3/ui/?s=MRVL&a=769835546&p=D&yr=0&mn=4&dy=0&id=p85139556362 | 2026-06-26 14:20:03 | open | 0.00% | 42377407 | Watch List | $0 | 0.00% | 0.24 | 0.09 | $0 | 0.00% | $0 | $0 | 0.00% | 0.00% | - | $315.00 | |||||||||||
| 2026-06-23 | AAOI | Applied Opto | 99 | $135.69 | -2.0572 | Wait for next Daily Money Wave Close > 20 with High Volume. | 5096 | Short Term | Long | $0.00 | 0.00% | Telecom | Mid | https://stockcharts.com/sc3/ui/?s=AAOI&a=1445937975&p=D&yr=0&mn=4&dy=0&id=p82566612659 | 2026-06-23 17:35:29 | open | 0.00% | 20418873 | Watch List | $0 | 0.00% | 0.00 | 0 | $0 | 0.00% | $0 | $0 | 0.00% | 0.00% | - | $190.00 | |||||||||||
| 2026-06-23 | ARM | ARM Holdings | 98 | $334.27 | -3.8653 | Wait for next Daily Money Wave Close > 20 with High Volume. | 5097 | Short Term | Long | $0.00 | 0.00% | Semiconductor | Large | https://stockcharts.com/sc3/ui/?s=ARM&a=2161528458&p=D&yr=0&mn=4&dy=0&id=p21515796478 | 2026-06-24 18:18:57 | open | 0.00% | 7829579 | Watch List | $0 | 0.00% | 0.00 | 0 | $0 | 0.00% | $0 | $0 | 0.00% | 0.00% | - |
Shop for a better price earlier in the day with Green Candle Buy Signal, on the same day that a Daily Money Wave Buy Signal will occur.
Many like to Buy the Swing Trades just before the Close, if the Money Wave is going to create a Buy Signal (Closing > 20 and up out of the Green Zone). Don’t Buy if the Security has already popped up too much. Money Wave Buy Signals are usually good for a 3-6 % move in a few days.
DAILY SWING SELLS TODAY NONE TODAY
________________________________________________________________________
WEEKLY SWING TRADE POPS
OCUL Oculus Thera. Weekly Swing Trade Buy today. Target $13.50.
AMPX Amprius Technologies Inc. Sold via Trade Alert at $11.50 for a 14.9 % Gain.
WEEKLY SWING TRADING (Formerly LONG TERM)Watch List and Charts to Buy Soon.
| Weekly Swing Watch List to Buy | Weekly Swing Charts to Buy |
| Current Weekly Positions | Current Weekly Charts |
| Closed Weekly Swing Trades | Stage Chart Investing |
DAY TRADING SETUPS. Today we had 18 scalp trades for nice Gains at our Trading Room. In this Emotional Market now, Day Trading Alerts are not being sent out on our Discord Site with Live Chatting. Please install Discord app on your PC or cell for mobile notifications. Check out our Live Stream.
Or look for Green Candle Buy Pops (Red Candle turns Green). Big Movers today: AMLX +16% SLV +6% & UNG + 21%.
Bonds were up today and are Below the Green Line.
Crude Oil was up $0.15 today at $59.49.
TOP PICK OF THE WEEK
MY TRADING DASHBOARD
SWING TRADING CURRENT POSITIONS
DAY TRADING SETUPS
TRADE ALERTS
STAGE CHART INVESTING
TOP 100 STOCKS
PREVIOUS GREEN LINE STOCKS