
By ATGL
Updated November 25, 2025
A false breakout represents one of the most frustrating challenges in trading. These deceptive price movements breach critical support or resistance levels, attracting traders into positions, only to reverse and trap them in losing trades. Recognizing these fake moves before committing capital separates consistently profitable traders from those who struggle with unnecessary losses. This article examines how to identify a false breakout in trading, confirm legitimate price movements, and implement protective strategies to safeguard your trading account.
What Is a False Breakout in Trading (and Why Does It Happen)?
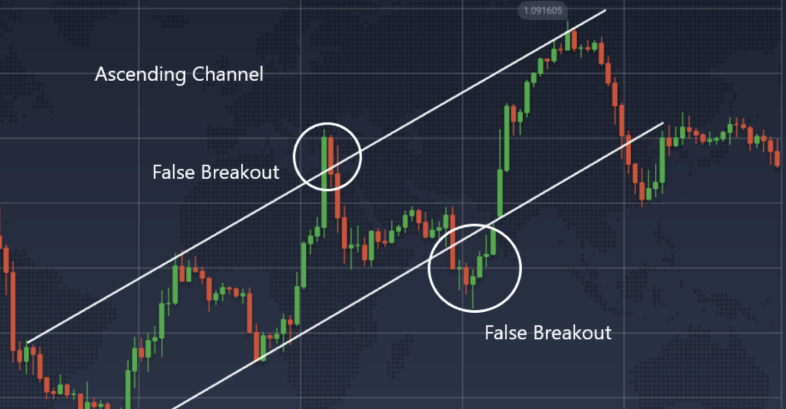
A false breakout, also known as a fakeout, occurs when price temporarily moves beyond an established support or resistance level but fails to maintain momentum. Instead of continuing in the breakout direction, price quickly reverses and closes back within the original range, trapping traders who entered positions expecting a sustained move.
Several factors contribute to false breakouts in financial markets. Low trading volume creates an environment where price can be pushed through key levels without sufficient conviction. Large institutional traders sometimes deliberately trigger stop-loss orders clustered near significant price levels, creating temporary breakouts before reversing the market in their favor. This practice, known as stop-loss hunting, exploits predictable order placement by retail traders. Market psychology also plays a substantial role, as fear of missing out drives traders to chase breakouts without proper confirmation.
How To Identify False Breakouts in Trading Using Price and Volume
Visual analysis of price action provides the first line of defense against false breakouts. Candlestick patterns reveal critical information about price movement authenticity. Long wicks or tails on candles that pierce support or resistance levels indicate rejection. When a candle closes back within the range after briefly exceeding a key level, it signals weak conviction behind the move.
Legitimate breakouts require decisive candle closes beyond the critical level. A valid breakout demonstrates commitment through a closing price that clearly exceeds the support or resistance zone, ideally by a margin that accounts for normal market noise. Some traders apply a percentage threshold, such as 1%-2%, to filter insignificant breaches from meaningful breakouts.
Volume analysis strengthens breakout confirmation significantly. Authentic breakouts typically accompany expanding volume as more market participants commit to the new price direction. When price breaches a key level on declining or average volume, skepticism is warranted. A legitimate breakout trading strategy requires volume expansion of at least 50% above the recent average, though this threshold varies across different markets and timeframes.
How To Detect False Breakouts With Technical Indicators
Technical indicators add quantitative confirmation to visual analysis, reducing reliance on subjective interpretation. The Relative Strength Index (RSI) identifies overbought or oversold conditions that often precede reversals. When price breaks resistance with RSI already in overbought territory (above 70), the breakout faces limited upside potential. Divergence between price and RSI provides particularly valuable insight—when price makes a new high but RSI fails to confirm, the breakout lacks momentum backing.
MACD, which measures momentum through the relationship between two moving averages, offers additional confirmation. A histogram expanding in the breakout direction supports the move’s validity. When MACD crosses its signal line in alignment with the breakout, it strengthens the case for a legitimate price move. Trading with RSI and MACD together creates a comprehensive momentum framework for breakout validation.
Bollinger Bands help assess volatility and identify overextended moves. Breakouts accompanied by expanding bands suggest increasing volatility that supports continued movement. However, when price touches or exceeds the outer band immediately after a breakout, it may indicate an overextension prone to reversal.
Average True Range (ATR) measures volatility levels and helps establish realistic expectations for breakout movement. During low ATR periods, markets lack the volatility necessary for sustained directional moves, increasing false breakout frequency.
How To Avoid Fake Breakouts in Trading
Protection against false breakouts requires a multi-layered approach combining confirmation requirements, risk management, and disciplined execution. Waiting for confirmation before entering trades represents the most effective defense. A confirmation candle that closes beyond the breakout level and maintains the new price territory reduces the likelihood of entering false moves.
Position sizing directly impacts how false breakouts affect your account. Smaller position sizes during initial breakout entries limit damage when trades fail. As confirmation accumulates through follow-through candles and trading indicators, increasing position size aligns capital allocation with probability.
Stop-loss placement requires strategic thinking beyond obvious levels. Placing stops directly below support or above resistance after a breakout creates vulnerability to stop-loss hunting. Instead, position stops beyond the range’s extreme or the breakout candle’s wick, providing buffer room for normal price fluctuation while still limiting downside.
Market context awareness prevents entries during conditions prone to false breakouts. Range-bound markets and low-liquidity periods produce higher false breakout rates. Trading near significant news releases or during holiday sessions when volume declines increases the risk of deceptive price movements.
False Breakout Trading Examples and What They Teach
Consider a stock trading in a well-defined range between $45 and $50 for several weeks. Price breaches $50 resistance with a single candle reaching $50.75, but closes at $49.85 on declining volume. RSI enters overbought territory above 75, and MACD shows divergence with price. The subsequent session opens with a gap down to $48.50, trapping traders who bought the breakout. This demonstrates the importance of waiting for confirmed closes and volume verification.
Another scenario involves a currency pair that breaks below major support at 1.1000, dropping to 0.9950 before reversing sharply. Traders who entered short positions without stops suffered significant losses as price rocketed back above 1.1000 within two sessions. This teaches the necessity of proper stop-loss placement and the danger of assuming breakouts will continue without confirmation.
These examples underscore several critical lessons. Emotional discipline prevents chasing moves without proper confirmation. Risk control through appropriate position sizing and stop-loss placement limits damage when false breakouts occur. The combination of price action, volume analysis, and momentum indicators creates a robust framework for distinguishing legitimate breakouts from traps.
Above the Green Line offers tools and strategies designed to help traders navigate complex market environments with greater confidence. The platform provides systematic approaches to market analysis that incorporate multiple confirmation factors, reducing exposure to false signals and improving trade quality. For traders committed to developing expertise in technical analysis and risk management, an Above the Green Line membership provides access to comprehensive resources and proven strategies that address the challenges discussed in this article. Developing skill in identifying false breakouts transforms this common frustration into a competitive advantage, as recognizing where others enter poor trades creates opportunities for well-timed, high-probability positions.

Related Articles

Moving Average Crossover Strategy: Using Trend Confirmation to Reduce Emotional Trading
ESPP Explained: The Employee Stock Purchase Plan Most Workers Leave Money On the Table By Ignoring
What Is a Bull Market? The Complete Guide Every Trader Needs Before the Next One Starts

Stock Market Hours: The ONLY Trading Windows That Actually Matter (Most Traders Get This Wrong)
