By ATGL
Updated October 22, 2025
An option chain is a structured display of options data that reveals how traders are positioning around a specific security. By analyzing strike prices, open interest, volume, and implied volatility, investors gain insight into market sentiment and potential price movements. This guide explains how to read an option chain and apply that information to identify trading opportunities, manage risk, and improve timing.
What Is an Option Chain?
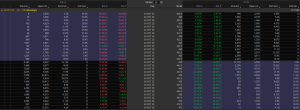
An option chain is a real-time table that shows all available call and put options for a specific security, organized by strike price and expiration date. Each contract reflects how the market is currently pricing potential future movement. Traders and institutional investors use this data to evaluate pricing, gauge sentiment, and identify where market participants are positioning.
Call options are typically listed on the left side of the chain, and put options on the right. Strike prices appear in the center column. You can adjust expiration dates to view contracts with different time horizons — helpful for both short-term trades and longer-term strategies. Each row provides key information, including the last price, bid and ask prices, daily volume, open interest, and implied volatility for that specific strike.
How Does an Option Chain Work?
Option chains aggregate liquidity and sentiment data into a single, structured view. Consider a standard option chain for a stock trading at $150. You may see calls and puts at strike intervals of $5, ranging from $130 to $170. Each strike contains its own ecosystem of activity, as some show negligible open interest and zero daily volume, while others display thousands of contracts traded with tight spreads and rising interest.
This disparity is what gives an option chain its analytical power. It helps you to detect concentrations of interest, often referred to as “open interest clustering,” which frequently correspond to areas of support, resistance, or gamma risk zones. Unlike traditional price charts, which reflect historical price action, the option chain reveals what traders expect to happen and where they are placing real capital to express those expectations.
How To Read an Option Chain: Step by Step
Reading an option chain starts with locating the underlying stock price and identifying the “at-the-money” strike, which is the contract whose strike price is closest to the current market price. This area often exhibits the highest implied volatility and trading interest due to its sensitivity to directional moves.
Once identified, observe how activity behaves above and below that level. For instance, a concentration of open interest and volume on call options $5 to $10 above the current price indicates traders are speculating or hedging for upside continuation. Conversely, rising put open interest, meaning an increase in the number of open contracts on put options, at lower strike prices often reflects defensive positioning or expectations of a potential decline.
The expiration date you select also significantly affects how to interpret the data. Shorter-term contracts (such as weekly options) respond more directly to immediate catalysts — like earnings or economic releases — whereas longer-dated options reflect broader macro or trend-based positioning.
Key indicators within the chain offer additional insight:
- Volume shows how actively a specific strike is being traded during the current session. While a single session’s volume spike can indicate short-term speculation, it requires context, particularly whether open interest is also increasing.
- Open Interest measures the total number of outstanding contracts that have not yet been settled. A high open interest level suggests strong institutional involvement and potential for price gravity around those strikes.
- Bid/Ask Spread reflects market makers’ confidence in pricing. Narrow spreads are indicative of liquid contracts with efficient pricing, while wider spreads signal uncertainty or illiquidity.
- Implied Volatility (IV) quantifies the market’s expectation for future price movement. It is not backward-looking. Instead, it derives from current option prices and reveals how volatile the market expects the underlying asset to be. Broader market volatility trends can also be monitored using benchmarks like the VIX Volatility Index.
How To Use an Option Chain for Trading Decisions
On the downside, increased put activity near support (with growing open interest and wider bid/ask spreads) may suggest bearish sentiment or protective positioning from larger players.
The interaction between volume and open interest is another key factor. When daily volume exceeds existing open interest, it often indicates new speculative positions. If both are high and rising, it typically reflects building momentum in one direction. Analyzing these patterns in context with the put/call open interest ratio can provide additional insight into market sentiment across strikes and expiration dates.
Implied volatility should be assessed relative to historical levels using metrics like IV Rank or IV Percentile. High IV may suggest overpriced options and greater risk of time decay if volatility contracts. This information can guide whether to favor buying or selling premium.
Finally, consider liquidity before entering a position. Illiquid options, like those with low open interest or wide bid/ask spreads, can result in poor fills and increased slippage. This underscores the importance of managing liquidity risk in trading, particularly in volatile or fast-moving markets.le interest or inconsistent pricing.
Option Chain Trading Examples for Different Market Scenarios
Consider a stock currently trading at $100. The option chain reveals high call open interest and strong volume at the $105 strike, with implied volatility rising and a recent bullish crossover on MACD. This confluence suggests positioning for a breakout, especially if the stock is testing resistance. You might initiate a debit call spread targeting that strike while capping risk.
Now assume the opposite: implied volatility rises sharply, and significant put open interest emerges at $95 and $90, just as the stock breaks below its 50-day moving average. These are signs of institutional hedging or bearish sentiment. You might respond by purchasing protective puts or implementing a bear put spread.
These examples demonstrate how option chain data, when read with supporting technical indicators, can inform short-term tactical moves as well as broader trend-based strategies.
Building an Option Chain Trading Strategy
Integrating option chain insights into a structured strategy involves more than isolated observations. Traders often start by filtering for high open interest near key technical levels and confirming with relative strength indicators or moving averages. Timing becomes more precise when implied volatility supports the directional bias — elevated IV for breakouts, compressed IV for mean reversion or consolidation plays.
For example, a long call strategy might require:
- Rising open interest and volume at near-the-money strikes.
- Elevated IV relative to historical norms.
- A technical trigger, such as a bullish pennant pattern or RSI breakout.
Traders focused on intraday execution can use these same inputs within a successful day trading strategy, adjusting for tighter stop-losses and shorter duration contracts.
What an Option Chain Reveals About Market Sentiment
Option chains serve as sentiment barometers, revealing institutional expectations and crowd psychology. Consistently rising call open interest at higher strikes suggests optimism and accumulation. When this activity is coupled with narrowing spreads and increasing volume, it points to directional conviction.
Conversely, increases in put open interest at lower strikes, especially if the underlying asset is declining, may reflect hedging or speculative pessimism. However, sentiment interpretation must remain dynamic. For instance, during earnings season or periods of high macro uncertainty, option chain data can become temporarily distorted by event-driven hedging.
Tracking how sentiment shifts across expiration cycles is also instructive. If near-term contracts show elevated implied volatility and strong call activity while longer-dated contracts remain subdued, it suggests short-term bullish speculation, not structural positioning. The opposite scenario of strong open interest and elevated IV in long-dated calls often signals institutional accumulation.
Start Applying Option Chain Insights Today
Understanding how to read an option chain transforms trading from reactive to proactive. The data reveals sentiment, positioning, and opportunity in a way that raw price action cannot. By analyzing strike clusters, volume shifts, and implied volatility in real time. Pairing this with technical confirmation means you can enhance both trade selection and execution quality.
Unlock deeper insights, tools, and strategies by exploring Above the Green Line memberships and improve the precision and consistency of your trading decisions.

Related Articles
[pt_view id=”9b64b383ox”]