Above the Green Line -01
  • Market Insights
        • Commentary
          • Daily
          • Weekly
        • BUY / SELL SIGNALS
          • Trade Posts
          • Recent Trade Alerts
          • Recent Day Trades
        • BLOGROLL
          • Dividend Growth Blog
          • ETF Sector Blog
          • Dow Dogs
          • TPOW Blog
  • Strategies
        • SWING TRADING
          • Current Positions
          • Watchlists
          • Closed Positions
          • Candidates - TOP 100
          • Specialty Stocks
        • WEEKLY STOCK PICK
          • TPOW Charts
          • TPOW Performance
          • TPOW Strategy Guide
          • TPOW Performance Dashboard
        • DAY TRADING
          • Watch List
        • ATGL DASHBOARD
        • ETF STRATEGIES
          • ETF Sector Rotation
          • ETF Sector Portfolio
        • DIVIDEND GROWTH
          • Dividend Growth Portfolio
          • Dividend Calendar
        • DOGS OF THE DOW
          • Dogs of the Dow Portfolio
          • DOW 5 Portfolio
  • Markets
        • US MARKET
          • Commodities
          • Energy
          • Precious Metals
          • Volatility
        • GLOBAL MARKETS
          • Market Indices
          • Economic Calendar
          • FOREX Heat Map
          • FOREX Cross Rates
          • Crypto Currency Market
  • Investing
    • Discord Community
    • Dashboard
  • Resources
        • ARTICLES
          • Dividend Growth Model Articles
          • ETF Articles
          • Investment Strategies Articles
          • Market and Economic Insights
          • Stock Trade Articles
          • Stock Reviews
        • TOOLS
          • Stock Scanners
          • Charting Software
          • Brokerage Firms
        • STOCK CHARTS
          • Key Components
          • Reading Charts
          • Drawing Stock Charts
          • Identifying Trends
        • RETIREMENT PLANNING
  • About
    • Contact Us
    • How to Win
    • #1 At Stockcharts
    • Disclaimer
    • FAQ
  • Log In
  • Subscribe

November 11, 2018

Green Line Weekly Nov 11, 2018


SPX Weekly
S&P 500 Stalled this week at the Red Line (50-day avg.)


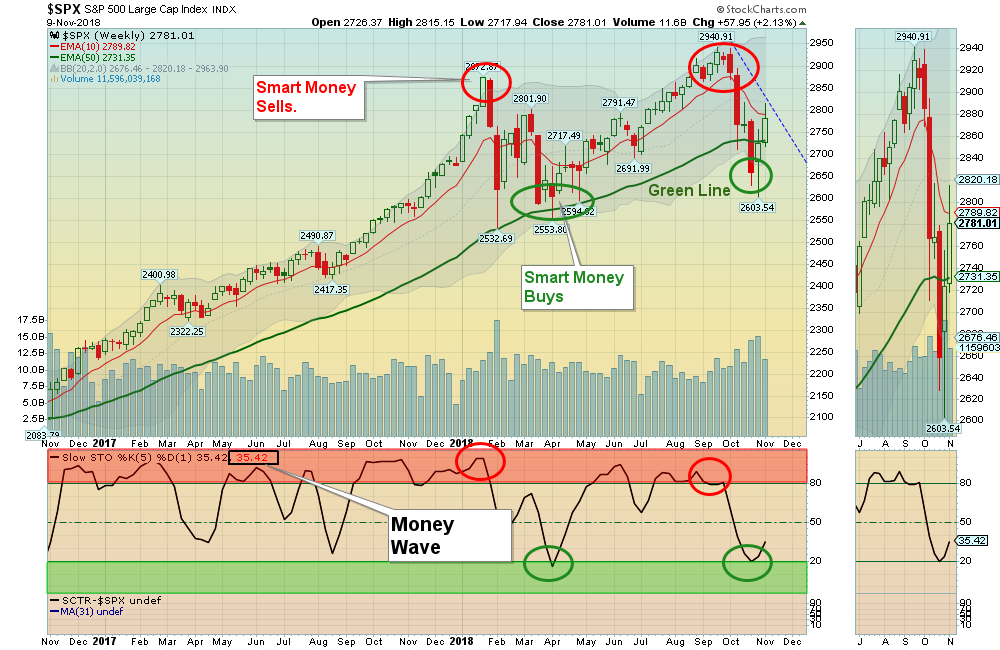
11/11/2018:  Markets bounced up again for the week, but now the Indexes are over over-bought on the Short Term.  The S&P 500 is back Above the Green Line, but failed at the Red Line (50-day avg.). Normally the Markets would dip back down soon to re-test the recent Lows. If the Selling is weak, then the Strongest Leaders that are holding Above the Green Line + Above 90 Relative Strength should go back up to re-test the September Highs.

Investments that are strugging Below the Green Line should probably be Sold on the next rally.

Money does not seem to be leaving the Markets, just rotating into Defensive Investments like XLP Consumer Staple Fund and XLU Utility Fund.

For the week the Dow was up 2.84%, the S&P 500 was up 2.16%, and the Nasdaq 100 was up 1.06%.   The Long Term Trend on the Stock Markets is UP.


The Inflation Index (CRB) was down 2.00% and is Below the Green Line, indicating Economic Weakness.

Bonds  were up  1.21% for the week and are Below the Green Line, indicating Economic Strength.

The US DOLLAR  was up 0.31%, but is currently over-bought.

Crude Oil was down 4.57% for the week at $60.18, and GOLD was down at $1208.60.

___________________________________________________________________________________________

MONEY WAVE BUYS SOON:   

We are currently in 6 logged Open Positions, for the Short & Medium Term.  There are 2 Investments on the Short Term Watch List. 

Be patient and WAIT for Green Zone Buy Signals!

______________________________________________________________________________________________

LONG TERM TRADES 

The Long Term List has become large, and if the Investments below can Bounce up off the Green Line with Above 80 Relative Strength, some could re-test their Highs.

AEO   AMER. EAGLE OUTFITTERS    Wait for weekly Close Above the Red Line of $22.84 (50-day avg.)     
ARWR    ARROWHEAD PHARMA.     Wait for weekly Close Above the Red Line of $14.75 (50-day avg.)     
CRM    SALESFORCE.COM    Wait for weekly Close Above the Red Line of $143.36 (50-day avg.) 
CVNA   CARVANA CO.    Wait for weekly Close Above the Red Line of $49.00 (50-day avg.)    
FDN    INTERNET FUND     Wait for weekly Close Above the Red Line of $131.36 (50-day avg.)     
FOSL    FOSSIL GROUP    Place Buy Stop Order above $24.28 on the Close.   
FTNT    FORTINET INC.    Wait for weekly Close Above the Red Line of $78.81 (50-day avg.)   
HRTX    HERON THERA.    Wait for weekly Close Above the Red Line of $30.89 (50-day avg.)  
QQQ    NASDAQ 100 Fund    Wait for weekly Close Above the Red Line of $174.65 (50-day avg.)    
URBN    URBAN OUTFITTERS    Place Buy Stop Order above $41.77 on the Close. 
WWE    WORLD WRESTLING    Wait for weekly Close Above the Red Line of $78.38 (50-day avg.) 

___________________________________________________________________________________________


Click for  Portfolio (Open Positions)  
Click for  Watch List
Click for  Closed Positions


Alert! Market Risk is MEDIUM (Yellow Zone). The probability of successful Short Term Trades is better, when the S&P 500 is down near the Green Line. 

Tell your Friends about the Green Line, and Help Animals.


QUESTION:   David writes “Many trading pros/teachers say do not trade below the 50 day moving average. I know you strongly believe the high technical ranking will overcome this and you advocate trades breaking out of Green Zone that are often well below the 50 day ma. 

Could you please comment on your view about trading below the 50ma?”


ANSWER:    Hi David, yes it is best to own Investments above the 50-day avg., because they are the Strongest. Investments that fall below the 50-day can return back up to the Highs, but it normally takes longer. (and the percentage moves can be larger).

So  Nimble Traders try to own Above the 50-day. It is more about deciding on how long you want to own a position.

Good trading, and tell your friends!


Related Post

– Green Line Weekly Nov 4, 2018

Subscribe to Our Newsletter

AGL Logo

Get our eBook Now!

Candlestick - A Swing Traders Friend

We don’t spam! Read our privacy policy for more info.

You’ve been successfully subscribed to our newsletter!

Voted #1 at Stock Charts

SH Chart
Inverse S&P 500 Fund (SH) will have a Money Wave Buy today.

Help Us Help Animals

Help Us Help Animals

Recent Comments

  • Market Breadth Indicators: A Trader’s Guide to Early Trend Detection on Backtesting: Definition and How a Trading Strategy Backtest Works
  • Island Reversal Pattern: Definition and Formation Explained on Double Top Pattern: How to Identify and Trade This Reversal Signal
  • Channel Pattern Guide: What It Is and Why It Matters on A Guide to Forecasting Using Moving Averages
  • What Is a Broadening Bottom Chart Pattern? Full Guide on Bull vs. Bear Market: An Investor’s Guide to Market Phases
  • ATGL Weekly Money Flow - 2025-05-11 on ATGL Top Pick of the Week! Apr 6, 2025

Become a Green Liner!

Help me make more Money in the Stock Market.

ON ATGL

  • DashBoard
  • Weekly Commentary
  • Daily Buy / Sell Signals
  • Day Trade Setup
  • Trading Rooms

Design & Develop By Pixelvect

STRATEGIES

  • Swing Trading
  • ATGL Pick of the Week
  • Dividend Growth
  • ETF Sector Rotation
  • Dogs of the Dow

HELP

  • ATGL Trading Rules
  • FAQ
  • Account Maintenance
  • Contact US
  • Join

FOLLOW US

Instagram Linkedin Twitter Facebook

© COPYRIGHT 2024 · ABOVETHEGREENLINE.COM · ALL RIGHTS RESERVED · PRIVACY · TERMS · CONTACT · WATCHLIST · CURRENT