By ATGL
Updated September 24, 2025
Whipsaw trading represents one of the most frustrating challenges for market participants, causing substantial losses through false signals and erratic price movements. This phenomenon traps you in positions that quickly reverse direction, leaving you with mounting losses and diminished confidence. Understanding how to identify and avoid these market conditions becomes essential for maintaining profitability and protecting capital.
What Is Whipsaw in Trading?
Whipsaw in trading occurs when asset prices move sharply in one direction, prompting position entries, only to reverse rapidly opposite. This violent back-and-forth movement creates a saw-like pattern on charts. The phenomenon manifests during market uncertainty with conflicting signals generating sudden directional changes.
Key characteristics include rapid reversals, increased volatility, and false breakouts. These conditions coincide with low volumes, making prices susceptible to manipulation by large participants or algorithms.
How Whipsaws Impact Trader Performance
Whipsaws generate consecutive losing trades through repeated stop-outs during false signals. They increase transaction costs via frequent entries and exits while creating psychological stress, leading to overtrading. Stop-loss orders trigger frequently, preventing profit accumulation and causing traders to abandon proven strategies.
Example: Whipsaw In A Sideways S&P 500 Market
During sideways S&P 500 conditions, momentum traders entering long positions at resistance watch prices reverse toward support. Switching to short positions triggers another reversal as the index bounces back, creating a cycle of losses through false signals.
Common Market Conditions That Trigger Whipsaws
Whipsaws are most common in volatile, low-liquidity markets triggered by various factors. High volatility creates extreme price fluctuations, establishing environments ripe for sudden reversals, with market sentiment shifting rapidly based on minimal developments.
Major news and events frequently trigger whipsaws. Unexpected economic data, earnings reports, or geopolitical developments shock markets, causing knee-jerk reactions that quickly reverse. Federal Reserve announcements, inflation data, and employment reports commonly create these conditions.
Overbought and oversold conditions often precede whipsaw movements. When assets reach extreme technical levels, corrections become likely, leading to sudden direction shifts that catch momentum traders unprepared.
Technical considerations generate false signals through fake breakouts where prices briefly move past key support or resistance levels before reversing. These failures coincide with low volume conditions unable to sustain directional moves.
Algorithmic trading systems amplify whipsaw conditions. High-frequency programs react faster than humans, creating cascading effects where initial movements trigger additional algorithmic responses, generating violent reversals.
How Traders Get Caught In False Signals
- Choppy Markets and Fake Breakouts: Prices oscillate within tight ranges without establishing clear trends. Traditional breakout strategies repeatedly fail as insufficient pressure exists to sustain directional moves beyond key technical levels.
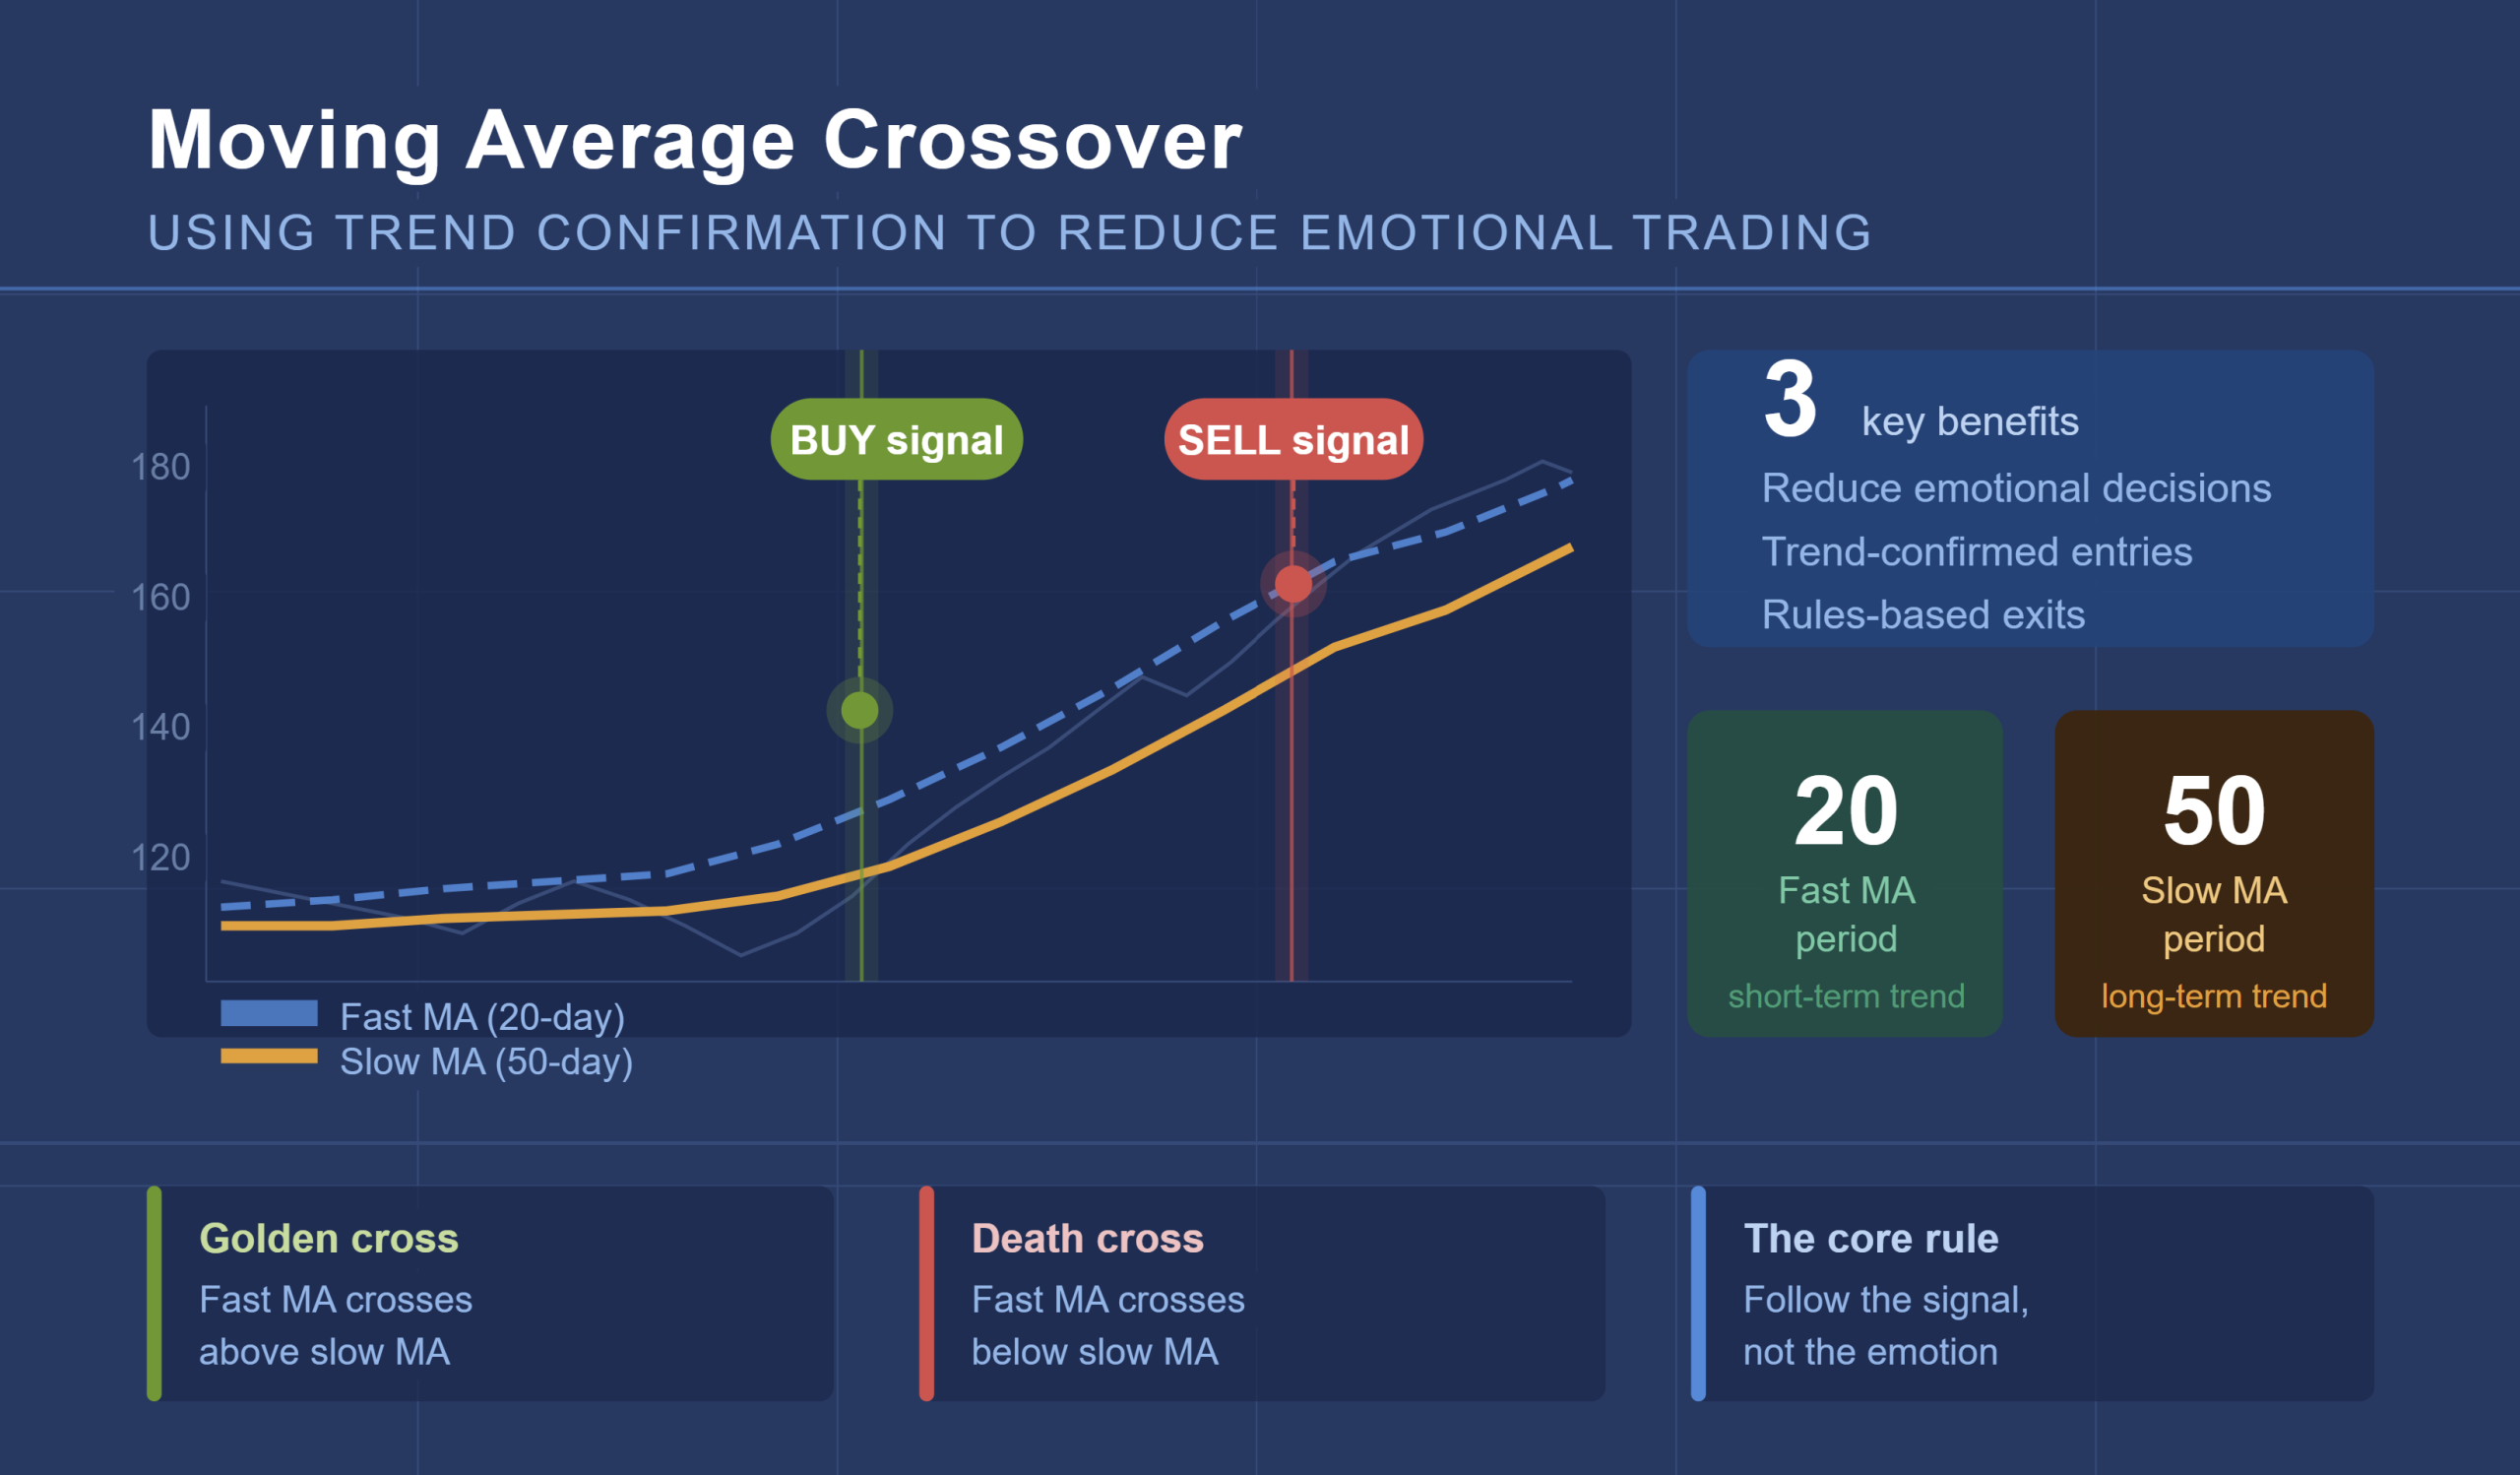
- Indicator Lag and Overreaction: Technical indicators lag price action, creating delayed signals coinciding with trend exhaustion rather than initiation. Moving average crossovers frequently generate buy signals near tops and sell signals near bottoms, maximizing whipsaw losses.
- Psychological Traps Leading To Overtrading: Repeated false signals create psychological pressure leading to overtrading and poor decisions. Traders abandon systematic approaches for frequent trading attempts, worsening performance as emotional decision-making replaces disciplined execution.
Techniques To Reduce Whipsaw Exposure
Multi-Timeframe Confirmation
Multi-timeframe analysis reduces false signal exposure by requiring confirmation across different time horizons. Buy signals on five-minute charts carry greater validity when 15-minute and 60-minute charts show bullish alignment before entering positions.
Using Trend Strength Indicators (e.g., ADX, MACD)
Average Directional Index (ADX) helps filter weak signals during choppy conditions. When ADX readings fall below 25, markets lack sufficient trend strength to sustain moves, suggesting that you avoid momentum strategies. Moving Average Convergence Divergence (MACD) can be enhanced by requiring additional confirmation from volume analysis.
Avoiding Trades Near Key Support And Resistance
Strategic positioning away from major support and resistance levels reduces false breakout exposure. Successful traders wait for price to establish momentum beyond these levels before entering, sacrificing some profit for higher probability setups.
Example: Using ADX To Filter False MACD Crossovers
When MACD generates bullish crossovers but ADX reads only 18, experienced traders avoid these signals. Low ADX readings coincide with sideways action, generating false signals. Requiring ADX above 25 for momentum trades significantly reduces whipsaw exposure.
Risk management plays a fundamental role in trading systems by limiting losses and preserving capital for high-probability opportunities. Effective protocols include position sizing rules, drawdown limits, and systematic stops. Common pitfalls include over-optimization, insufficient backtesting, and failure to account for transaction costs.
Smarter Stop-Loss And Trade Management
- Adaptive Stops Based on Volatility or ATR: Traditional fixed stops get triggered by market noise rather than genuine trend changes. Adaptive stops using Average True Range (ATR) adjust to current volatility, providing breathing room during normal fluctuations while maintaining protection. When ATR increases, stop distances widen accordingly.
- Trailing Stops That Flex With Market Movement: Trailing mechanisms offer superior management compared to static approaches. These systems tighten stops during trending moves to lock profits while loosening during consolidation to avoid unnecessary exits. Advanced versions incorporate technical levels or volatility measures.
- Setting Exit Criteria To Limit Damage: Clear exit criteria established before trades limit emotional decision-making. Criteria include time-based exits, profit targets, technical violations, or indicator reversals. Defining conditions in advance prevents holding losing positions hoping for reversals.
Example: Tight Stop Gets Triggered In Choppy Nasdaq
A trader using tight 1% stops finds positions repeatedly stopped out by normal Nasdaq volatility. Implementing ATR-based stops at 2x the 14-period ATR avoids false exits while maintaining risk control, recognizing Nasdaq’s volatility requires wider stops.
Building A Strategy For Whipsaw-Prone Markets
- When To Stay Out And Preserve Capital: Recognize whipsaw-prone conditions through declining volume, narrow ranges, conflicting signals across timeframes, and ADX below 20. Focus on stock ideas and analysis rather than forcing trades during unfavorable periods.
- How To Backtest For Noise Sensitivity: Test strategies across trending, sideways, and volatile periods. Analyzing performance during different volatility regimes reveals which approaches work best in specific environments and helps optimize parameters for current conditions.
- Developing A Playbook For Sideways Conditions: Create protocols for range-bound markets, including reduced position sizes, wider stops, different indicators, or alternative strategies. Predetermined responses improve consistency and reduce stress during challenging periods.
Example: Strategy Performance In Trending vs. Flat Markets
Momentum strategies might show 65% win rates during trending periods but only 35% during sideways markets. Understanding these differences allows traders to adjust approaches, switching to mean-reversion strategies or reducing position sizes based on market character.
Trading strategies require regular review to maintain effectiveness as conditions evolve. Quarterly reviews help identify changing dynamics, assess performance across different conditions, and make necessary adjustments. This process should include recent performance analysis, market condition changes, and parameter optimization.
Make Smarter Trading Decisions Today
The key to long-term success lies in recognizing that avoiding bad trades often proves more important than finding perfect entries. Focus on day trading tips and day trading patterns that emphasize high-probability setups while using stock charts for comprehensive technical analysis.
To accelerate your progress in mastering these advanced techniques and gain access to professional-grade tools for identifying high-probability trading opportunities, consider exploring Above the Green Line’s comprehensive membership programs. These resources provide the systematic approach and ongoing support necessary for consistent trading success in any market

Related Articles
[pt_view id=”9517038dwu”]