Above the Green Line -01
  • Market Insights
        • Commentary
          • Daily
          • Weekly
        • BUY / SELL SIGNALS
          • Trade Posts
          • Recent Trade Alerts
          • Recent Day Trades
        • BLOGROLL
          • Dividend Growth Blog
          • ETF Sector Blog
          • Dow Dogs
          • TPOW Blog
  • Strategies
        • SWING TRADING
          • Current Positions
          • Watchlists
          • Closed Positions
          • Candidates - TOP 100
          • Specialty Stocks
        • WEEKLY STOCK PICK
          • TPOW Charts
          • TPOW Performance
          • TPOW Strategy Guide
          • TPOW Performance Dashboard
        • DAY TRADING
          • Watch List
        • ATGL DASHBOARD
        • ETF STRATEGIES
          • ETF Sector Rotation
          • ETF Sector Portfolio
        • DIVIDEND GROWTH
          • Dividend Growth Portfolio
          • Dividend Calendar
        • DOGS OF THE DOW
          • Dogs of the Dow Portfolio
          • DOW 5 Portfolio
  • Markets
        • US MARKET
          • Commodities
          • Energy
          • Precious Metals
          • Volatility
        • GLOBAL MARKETS
          • Market Indices
          • Economic Calendar
          • FOREX Heat Map
          • FOREX Cross Rates
          • Crypto Currency Market
  • Investing
    • Discord Community
    • Dashboard
  • Resources
        • ARTICLES
          • Dividend Growth Model Articles
          • ETF Articles
          • Investment Strategies Articles
          • Market and Economic Insights
          • Stock Trade Articles
          • Stock Reviews
        • TOOLS
          • Stock Scanners
          • Charting Software
          • Brokerage Firms
        • STOCK CHARTS
          • Key Components
          • Reading Charts
          • Drawing Stock Charts
          • Identifying Trends
        • RETIREMENT PLANNING
  • About
    • Contact Us
    • How to Win
    • #1 At Stockcharts
    • Disclaimer
    • FAQ
  • Log In
  • Subscribe

October 10, 2018

Money Wave Alert! Oct 10, 2018

SPX Chart
S&P 500 Fell below Support of 2872!


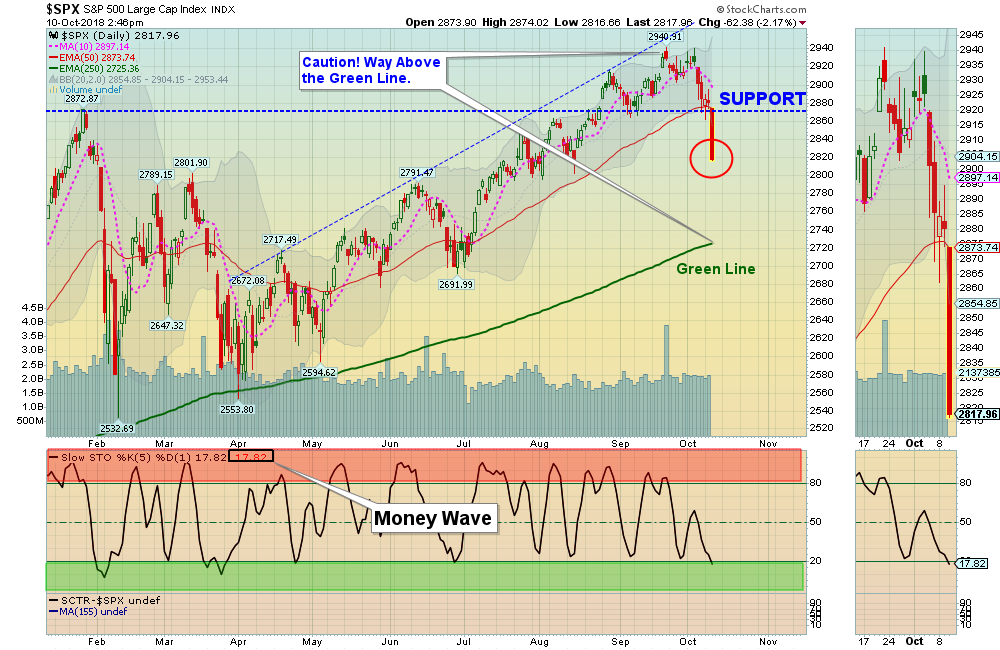
Markets  dumped today as the S&P 500 FELL BELOW the Red Line (50-day avg.) and Support of 2872. That indicates that the Markets are weaker than many had expected, but the S&P 500 is now down in the Green Zone.

The FEAR Index (VIX) has jumped up 27% today, indicating that Tammy is buying Put options for further declines. Tammy is usually wrong.

The Strongest Leaders have corrected down enough for better Money Wave Buys soon. Try to Buy Investments that are holding Above the Red Lines (50-day avg.) as they should bounce better.

Bond prices  have quit going down, as they are very Over-Sold. The 30 year T-Bond Yield is at  3.38%..  

Crude Oil was down today at $74.80.

_____________________________________________________________________________________

The Following Investments will probably have a Money Wave Buy Signal soon.
(Slow Stochastic Closing > 20) on today’s Close.


BUYS TODAY   


CRON    CRONOS GROUP    Money Wave Buy today.  CRON will not be logged, as it is already up 6% today.

We will “Not Log” trades if the Reward/Risk is not at least 2:1.


Money Wave Buys Signals Soon:   

AMZN    AMAZON.COM

BSX    BOSTON SCIENTIFIC CORP.    

LOW    LOWES CO.      

QCOM    QUALCOMM, INC.  

SQ    SQUARE, INC.    Money Wave must Close in the Green Zone.

TEAM    ATLASSIAN CORP.  

XLV    HEALTH CARE FUND    Money Wave must Close in the Green Zone.


Please be patient and wait for Money Wave Buy Signals.  We will email you when they are ready. Click on Watch List.

Emotions are very high now, so please do not Buy unless you are VERY NIMBLE. The Leaders are still Way Above the Green Lines (all Investments eventually return to their Green Lines).

______________________________________________________________________________________


SELLS TODAY   


LOWER the Sell Stop Loss on     AMD    ADVANCED MICRO    to the Green Line of  $17.30 until Market bottoms. Relative Strength is still 99.

LOWER the Sell Stop Loss on     ETP    ENERGY TRANSFER LP     to $20.74. Relative Strength is still 94.

LOWER the Sell Stop Loss on     FDC    FIRST DATA CORP.   to the Green Line of  $20.43 until Market bottoms. Relative Strength is still 99.

LOWER the Sell Stop Loss on     ROKU    ROKU INC.   to the Green Line of  $44.14 until Market bottoms. Relative Strength is still 99.

LOWER the Sell Stop Loss on     VKTX    VIKING THERA.   to the Green Line of  $8.22 until Market bottoms. Relative Strength is still 99.


LOWER the Sell Stop Loss on     TNDM    TANDEM DIABETICS   to the Green Line of  $22.10 until Market bottoms. Relative Strength is still 99.  This trade was not logged.

EXIT    PBF    PBF ENERGY    if it is going to Close below the Pink Line around $$51.72.  This trade was not logged.


Please Check   PORTFOLIO  (Open Positions) and adjust your Sell Stops.

Click for  CLOSED POSITIONS.

Many like to Buy the day before, near the Close, if the Money Wave is going to create a Buy Signal (Closing > 20).

Don’t Buy if the Investment has already popped up too much. Money Wave Buys are usually good for a 3-6 %  move in a few days. We will “Not Log” trades if the Reward/Risk is not at least 2:1.

Related Post

– Bond prices

Subscribe to Our Newsletter

AGL Logo

Get our eBook Now!

Candlestick - A Swing Traders Friend

We don’t spam! Read our privacy policy for more info.

You’ve been successfully subscribed to our newsletter!

Voted #1 at Stock Charts

SH Chart
Inverse S&P 500 Fund (SH) will have a Money Wave Buy today.

Help Us Help Animals

Help Us Help Animals

Recent Comments

  • Market Breadth Indicators: A Trader’s Guide to Early Trend Detection on Backtesting: Definition and How a Trading Strategy Backtest Works
  • Island Reversal Pattern: Definition and Formation Explained on Double Top Pattern: How to Identify and Trade This Reversal Signal
  • Channel Pattern Guide: What It Is and Why It Matters on A Guide to Forecasting Using Moving Averages
  • What Is a Broadening Bottom Chart Pattern? Full Guide on Bull vs. Bear Market: An Investor’s Guide to Market Phases
  • ATGL Weekly Money Flow - 2025-05-11 on ATGL Top Pick of the Week! Apr 6, 2025

Become a Green Liner!

Help me make more Money in the Stock Market.

ON ATGL

  • DashBoard
  • Weekly Commentary
  • Daily Buy / Sell Signals
  • Day Trade Setup
  • Trading Rooms

Design & Develop By Pixelvect

STRATEGIES

  • Swing Trading
  • ATGL Pick of the Week
  • Dividend Growth
  • ETF Sector Rotation
  • Dogs of the Dow

HELP

  • ATGL Trading Rules
  • FAQ
  • Account Maintenance
  • Contact US
  • Join

FOLLOW US

Instagram Linkedin Twitter Facebook

© COPYRIGHT 2024 · ABOVETHEGREENLINE.COM · ALL RIGHTS RESERVED · PRIVACY · TERMS · CONTACT · WATCHLIST · CURRENT