Above the Green Line -01
  • Market Insights
        • Commentary
          • Daily
          • Weekly
        • BUY / SELL SIGNALS
          • Trade Posts
          • Recent Trade Alerts
          • Recent Day Trades
        • BLOGROLL
          • Dividend Growth Blog
          • ETF Sector Blog
          • Dow Dogs
          • TPOW Blog
  • Strategies
        • SWING TRADING
          • Current Positions
          • Watchlists
          • Closed Positions
          • Candidates - TOP 100
          • Specialty Stocks
        • WEEKLY STOCK PICK
          • TPOW Charts
          • TPOW Performance
          • TPOW Strategy Guide
          • TPOW Performance Dashboard
        • DAY TRADING
          • Watch List
        • ATGL DASHBOARD
        • ETF STRATEGIES
          • ETF Sector Rotation
          • ETF Sector Portfolio
        • DIVIDEND GROWTH
          • Dividend Growth Portfolio
          • Dividend Calendar
        • DOGS OF THE DOW
          • Dogs of the Dow Portfolio
          • DOW 5 Portfolio
  • Markets
        • US MARKET
          • Commodities
          • Energy
          • Precious Metals
          • Volatility
        • GLOBAL MARKETS
          • Market Indices
          • Economic Calendar
          • FOREX Heat Map
          • FOREX Cross Rates
          • Crypto Currency Market
  • Investing
    • Discord Community
    • Dashboard
  • Resources
        • ARTICLES
          • Dividend Growth Model Articles
          • ETF Articles
          • Investment Strategies Articles
          • Market and Economic Insights
          • Stock Trade Articles
          • Stock Reviews
        • TOOLS
          • Stock Scanners
          • Charting Software
          • Brokerage Firms
        • STOCK CHARTS
          • Key Components
          • Reading Charts
          • Drawing Stock Charts
          • Identifying Trends
        • RETIREMENT PLANNING
  • About
    • Contact Us
    • How to Win
    • #1 At Stockcharts
    • Disclaimer
    • FAQ
  • Log In
  • Subscribe

April 9, 2025

Money Wave Alert! Apr 9, 2025

SPY chart
The S&P 500 Index shot up 9 % after completing a “W” pattern.
SWING TRADING (SHORT TERM)
Watchlist and Charts
Watch ListWatch List Charts
Current PositionsCurrent Charts
Closed ResultsTrading Dashboard
TOP PICK OF THE WEEK
Current Pick and Chart
Top Pick of the WeekFeatured Stock Chart

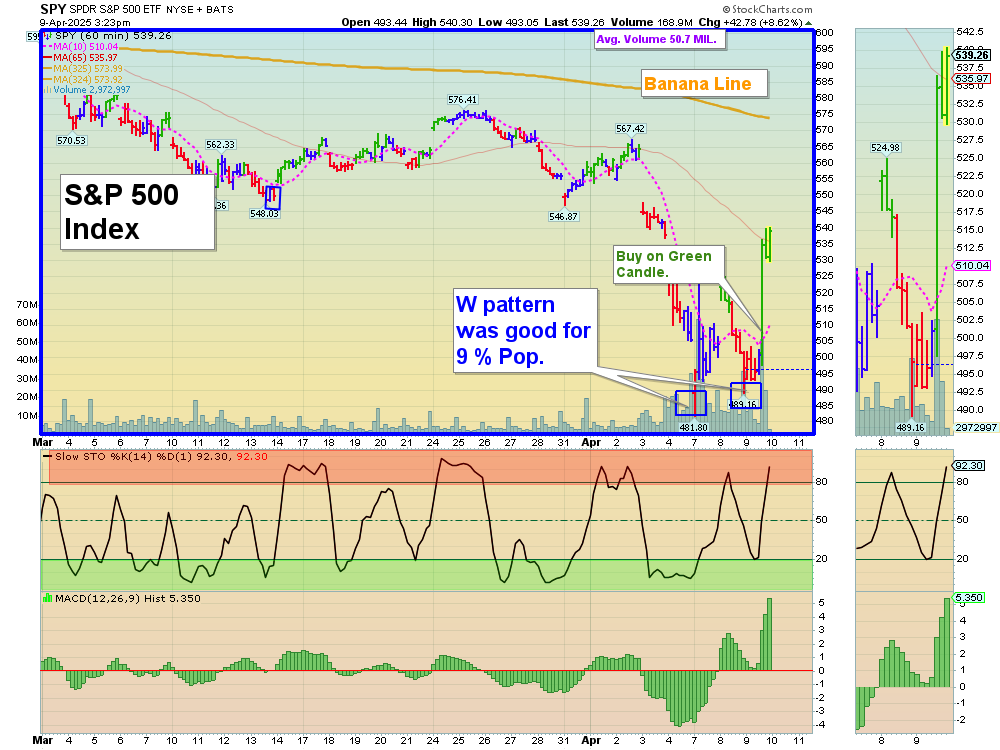
April 9, 2025. Markets surged higher on Good News about Tariffs. At today’s market open, the Nasdaq experienced a brief dip, completing a ‘W’ pattern, similar to the SPY’s recent formation. Then the Markets shot up like a rocket!

This suggests a potential move toward the fair value, referred to as the Banana Line above. FEAR has quickly faded. Gold and gold miners are currently exhibiting robust performance, with gold prices rising over 3% and mining stocks climbing accordingly. 

Wait for more Buy Signals coming up out of the Green Zones. CHARTS  The best moves happen when the S&P 500 Index is also coming up out of the Green Zone. ______________________________________________________________________________

BUYS TODAY   4/9/2025      

GILD      GILIAD SCIENCES       Swing Trade Buy on the Close today, and the Volume was good (3 Star trade).
IAU      iShares Gold Trust.      Swing Trade Buy on the Close today, but it is already up 4 % today (2 Star trade).
LYG     LLOYD’S GROUP       Swing Trade Buy on the Close today, but it is already up 8 % today (2 Star trade).

BUYS SOON           

EXC      EXELON CORP      Wait for next Daily Money Wave Close > 20 with High Volume. 
CME      CME GROUP INC      Wait for next Daily Money Wave Close > 20 with High Volume. 
PLTR      Palantir Technologies Inc.    Money Wave must Close in the Green Zone.               
LX      LexinFintech Holdings Ltd.    Money Wave must Close in the Green Zone.               
NGD      New Gold Inc.   Wait for next Daily Money Wave Close > 20 with High Volume.        
  
Shop for a better price earlier in the day with Green Candle Buy Signal, on the same day that a Daily Money Wave Buy Signal will occur.        

Many like to Buy the Swing Trades just before the Close, if the Money Wave is going to create a Buy Signal (Closing > 20 and up out of the Green Zone). Don’t Buy if the Security has already popped up too much. Money Wave Buy Signals are usually good for a 3-6 % move in a few days.       

SELLS TODAY       NONE TODAY    

_____________________________________________________________________________

DAY TRADING SETUPS.  Today we had 15 scalp trades for nice Gains at our Trading Room. In this Emotional Market now, Day Trading Alerts are not being sent out on our Discord Site with Live Chatting. Please install Discord app on your PC or cell for mobile notifications. Check out our Live Stream.

Or look for Green Candle Buy Pops (Red Candle turns Green). Big Movers today:    FNGA + 38%  SOXL +52% TSLL +43%                   

BANANA HUNT TRADING CHARTS.

Bonds were down today and are Below the Green Line. 
Crude Oil was up $3.09 today at $62.65.    

NEW! TOP PICK OF THE WEEK

MY TRADING DASHBOARD 
SWING TRADING CURRENT POSITIONS
DAY TRADING SETUPS
TRADE ALERTS
STAGE CHART INVESTING
GREEN LINE CHARTS AT STOCKCHARTS
ARE YOUR INVESTMENTS ABOVE THE GREEN LINE?
GREEN LINE RULES
ETF SECTOR ROTATION SYSTEM
Updated TOP 100 LIST Updated Apr 1, 2024       

Related Post

– PLTR

Subscribe to Our Newsletter

AGL Logo

Get our eBook Now!

Candlestick - A Swing Traders Friend

We don’t spam! Read our privacy policy for more info.

You’ve been successfully subscribed to our newsletter!

Voted #1 at Stock Charts

SH Chart
Inverse S&P 500 Fund (SH) will have a Money Wave Buy today.

Help Us Help Animals

Help Us Help Animals

Recent Comments

  • ATGL Weekly Money Flow - 2025-07-13 on AGTL Top Pick of the Week! May 11, 2025
  • Market Breadth Indicators: A Trader’s Guide to Early Trend Detection on Backtesting: Definition and How a Trading Strategy Backtest Works
  • Island Reversal Pattern: Definition and Formation Explained on Double Top Pattern: How to Identify and Trade This Reversal Signal
  • Channel Pattern Guide: What It Is and Why It Matters on A Guide to Forecasting Using Moving Averages
  • What Is a Broadening Bottom Chart Pattern? Full Guide on Bull vs. Bear Market: An Investor’s Guide to Market Phases

Become a Green Liner!

Help me make more Money in the Stock Market.

ON ATGL

  • DashBoard
  • Weekly Commentary
  • Daily Buy / Sell Signals
  • Day Trade Setup
  • Trading Rooms

Design & Develop By Pixelvect

STRATEGIES

  • Swing Trading
  • ATGL Pick of the Week
  • Dividend Growth
  • ETF Sector Rotation
  • Dogs of the Dow

HELP

  • ATGL Trading Rules
  • FAQ
  • Account Maintenance
  • Contact US
  • Join

FOLLOW US

Instagram Linkedin Twitter Facebook

© COPYRIGHT 2024 · ABOVETHEGREENLINE.COM · ALL RIGHTS RESERVED · PRIVACY · TERMS · CONTACT · WATCHLIST · CURRENT