By ATGL
Updated March 12, 2026
A pooled investment fund gives you the same opportunity to access a wide range of asset classes that institutional investors have. Your money will go toward shares in an aggregated fund that consists of multiple assets, such as stocks, bonds, and other securities. Pooled funds benefit from economies of scale, meaning you’ll reap the rewards of holding a variety of assets without having to buy individual shares in each security.
There are several types of pooled investment vehicles to choose from, including mutual funds, hedge funds, pension funds, unit investment trusts, and exchange-traded funds (ETFs).
Exchange-traded funds have become one of the most popular pooled investment vehicles because of their transparency, liquidity, and low costs. Investors who want a deeper understanding of how ETFs work and how they are evaluated within diversified portfolios can explore the ETF Investing Guide, which explains ETF structures, performance considerations, and portfolio applications.
Usually, an investment manager oversees each fund, and they’ll purchase and sell assets on behalf of the individuals who invest in it.
The Importance of Tracking to Reach Investment Objectives
Ensuring the performance of your investments aligns with your investment goals is critical to any strategy. Most financial advisors suggest reviewing your returns on a quarterly basis. Tracking the performance of your portfolio helps you determine whether it’s meeting your financial goals or whether you need to make adjustments to your asset allocation, risk tolerance, or investment strategy.
There are various ways to track your investments, including robo-advisors, stock-tracking apps, and portfolio performance evaluation tools. Performance measures like yield and rate of return can help you evaluate the profitability of your investments and compare them with other options. You can combine different methods depending on your expertise and available time. However, it’s critical to avoid over-tracking which can lead to emotional reactions, excessive trading, or unnecessary fees. A quarterly analysis is usually enough to keep you on track with your investment goals.
4 Essential Metrics You Should Keep an Eye on and Why
Monitoring the performance of pooled funds is similar to monitoring other asset classes, in that it starts with deciding the appropriate metrics to use. Consider these four pooled investment fund performance metrics when evaluating potential investments.
1. IRR to Predict the Profitability of an Investment
The internal rate of return (IRR) is commonly used for capital investment purposes to determine a project’s future profitability. An organization can evaluate the project’s expected annual growth rate and compare it against the growth rate of other potential projects or investments. Likewise, individual investors can also use IRR to evaluate the future performance of pooled funds and compare it against their desired target return.
If the IRR exceeds your desired return, the pooled investment is a buy; if not, it’s a reject. You can also compare the IRRs from multiple pooled funds to assist in your evaluation process.
2. MOIC to Measure Private Equity Fund Performance
The multiple on invested capital (MOIC) metric helps evaluate the return from an investment compared with the initial outlay. It’s generally used to measure the performance of private equity (PE) funds. You can also use it to compare one PE fund’s performance against another’s.
To calculate MOIC, simply divide the total cash inflows from an investment by the initial cash outlay. The result is a multiple indicating how much every dollar of invested capital earned over the investment term. Generally, the higher the multiple, the better the performance of the PE fund.
3. PME To Compare Private Equity Investments to a Benchmark
Public market equivalent (PME) allows investors to compare the performance of a PE fund against a comparable public group of investments, such as an index. The index chosen mirrors the PE fund’s asset base. For example, a PE fund that invests in tech companies might use PME to compare performance against a public tech index like QQQ.
Tracking PME helps portfolio managers determine whether a PE fund is performing better or worse than publicly traded funds. If the results suggest the PE fund is underperforming, a reallocation of investments may be necessary.
4. ENS To Measure a Diversified Portfolio
The effective number of stocks (ENS) is a calculation used to determine the diversification of a portfolio. It’s a variation of the Herfindahl-Hirschman index, which applies the squared weights of individual stocks held in a single portfolio of investments. The reciprocal value of the HHI represents the ENS. A high ENS value indicates a greater concentration risk in a portfolio or pooled investment, while a lower ENS signifies less concentration exposure.
Less diversified pooled investments have more exposure to market swings since their performance is driven by specific asset classes. Incorporating ENS into your investment decisions can help you identify pooled investments that are particularly vulnerable to ups and downs in the market.
Perfect Your Investment Strategy With Help From Above The Green Line
Above The Green Line can help you diversify your investments by following an ETF sector rotation strategy. Our ETF sector rotation strategy follows the principles of stage analysis outlined in Stan Weinstein’s Secrets for Profiting in Bull and Bear Markets. We identify trading opportunities based on the price dynamics expressed in market sentiment through cycles of bottoms, breakouts, uptrends, breakdowns, and downtrends. Ideally, investors benefit from the growth in specific sectors while minimizing market volatility risks. Learn more about the Green Line ETF sector rotation strategy and how you can use it to identify investment opportunities today.
Sources:
Pooled Investment Funds: A Comprehensive Guide for Investors – Fintech News
Pooled Funds: Definition, Examples, Pros & Cons (investopedia.com)
How to Determine Profitability & Strategic Decisions | HBS Online
What Is IRR? Guide for Investors | The Motley Fool
Multiple on Invested Capital (MOIC) | Formula + LBO Calculator (wallstreetprep.com)
What Does PME Stand For? | Allvue (allvuesystems.com)
Effective Number of Stocks – Breaking Down Finance

Related Articles

Risk-Adjusted Returns: Why Smarter Investors Focus on More Than Performance

Moving Average Crossover Strategy: Using Trend Confirmation to Reduce Emotional Trading
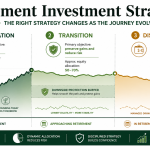
Retirement Investment Strategies: The Phase-by-Phase Framework That Changes How You Approach Every Stage
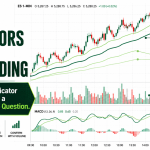
Best Indicators for Day Trading: The 7 That Elite Traders Actually Use (And Why Most Lists Get It Wrong)
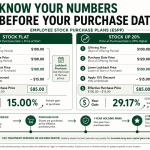
ESPP Explained: The Employee Stock Purchase Plan Most Workers Leave Money On the Table By Ignoring