Above the Green Line -01
  • Market Insights
        • Commentary
          • Daily
          • Weekly
        • BUY / SELL SIGNALS
          • Trade Posts
          • Recent Trade Alerts
          • Recent Day Trades
        • BLOGROLL
          • Dividend Growth Blog
          • ETF Sector Blog
          • Dow Dogs
          • TPOW Blog
  • Strategies
        • SWING TRADING
          • Current Positions
          • Watchlists
          • Closed Positions
          • Candidates - TOP 100
          • Specialty Stocks
        • WEEKLY STOCK PICK
          • TPOW Charts
          • TPOW Performance
          • TPOW Strategy Guide
          • TPOW Performance Dashboard
        • DAY TRADING
          • Watch List
        • ATGL DASHBOARD
        • ETF STRATEGIES
          • ETF Sector Rotation
          • ETF Sector Portfolio
        • DIVIDEND GROWTH
          • Dividend Growth Portfolio
          • Dividend Calendar
        • DOGS OF THE DOW
          • Dogs of the Dow Portfolio
          • DOW 5 Portfolio
  • Markets
        • US MARKET
          • Commodities
          • Energy
          • Precious Metals
          • Volatility
        • GLOBAL MARKETS
          • Market Indices
          • Economic Calendar
          • FOREX Heat Map
          • FOREX Cross Rates
          • Crypto Currency Market
  • Investing
    • Discord Community
    • Dashboard
  • Resources
        • ARTICLES
          • Dividend Growth Model Articles
          • ETF Articles
          • Investment Strategies Articles
          • Market and Economic Insights
          • Stock Trade Articles
          • Stock Reviews
        • TOOLS
          • Stock Scanners
          • Charting Software
          • Brokerage Firms
        • STOCK CHARTS
          • Key Components
          • Reading Charts
          • Drawing Stock Charts
          • Identifying Trends
        • RETIREMENT PLANNING
  • About
    • Contact Us
    • How to Win
    • #1 At Stockcharts
    • Disclaimer
    • FAQ
  • Log In
  • Subscribe

July 6, 2023

Money Wave Alert! Jul 6, 2023

SVXY Chart
The Greed Index (SVXY) dumped out this morning, but then recovered.

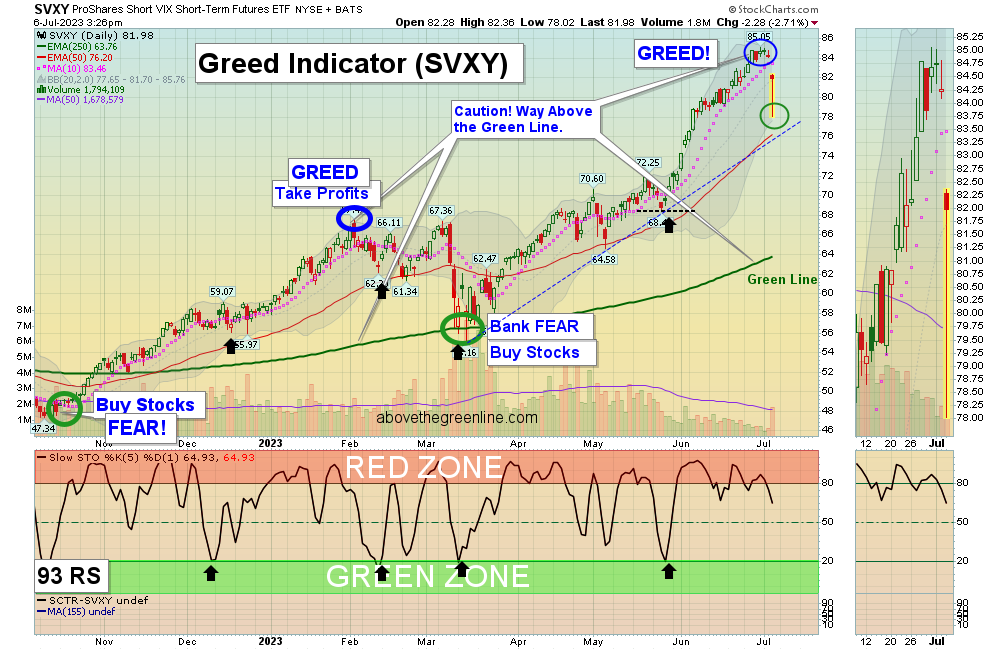
Markets were lower today as the S&P 500 & NASDAQ 100 Funds could not make higher highs to avoid the dreaded “M” or Double Top pattern. Some real Selling came in early to move the FEAR Index (VIX) up 16%, and then Buying came in. The S&P 500  & NASDAQ 100 Indices were was able to hold above the 10-day averages to avoid short term Sell Signals.

Most of the Leaders were up in the Red Zones (probably too late to Buy for the short term). Please be patient and wait for more Buy Signals in the Green Zones.  CHARTS  The best moves happen when the S&P 500 Index is also coming up out of the Green Zone. 

__________________________________________________________________________

BUYS TODAY   7/6/2023      NONE TODAY

BUYS TOMORROW                    

OSCR      OSCAR HEALTH INC.       Wait for Money Wave Close > 20 with High Volume. 

Shop for a better price earlier in the day with Triple Buy Signal, on the same day that a Daily Money Wave Buy Signal will occur.  

BUYS SOON                       

PBR      PETROBRAS ENERGY      Money Wave must Close in the Green Zone.     

UBER      UBER TECH.      Money Wave must Close in the Green Zone.

Please be patient and Wait for Money Wave Buy Signals.  We will email you when they are ready. Follow on the WATCH LIST.   

SELLS TODAY                   

APLD      APPLIED DIGITAL     Slipped below the Buy Price yesterday and was Stopped Out even, The Target was Hit at $10 for a 7 % Gain.

DKNG      DRAFTKINGS INC.      EXIT if it is going to Close below the Pink Line around $25.77.  The Target was already Hit at $26 for a 4.2 % Gain.     

ITB      HOME BUILDING FUND       EXIT if it is going to Close below the Pink Line around $83.68.  The Target was already Hit for a 3.1 % Gain.     

MVIS      MICROVISION INC.       Slipped below the Buy Price and was Stopped Out even.     

SOFI      SOFI TECH.    Lower Sell Stop Loss below $7.71 until it bottoms.     

YEXT      YEXT INC.      EXIT if it is going to Close below Support of $10.47. This trade was not logged.

_________________________________________________________________________

DAY TRADING SETUPS.  Day Trading Alerts are now being sent out on our new Discord Site with Live Chatting. Please install Discord app on your pc or cell for mobile notifications. Also follow our YouTube Live Stream for quick trades. Or look for Triple Buy Pops (3 Green Circles). Movers today:   VIXY (+12%) LABD (+7%) & SOXS  (+6%). Try out the Side by Side layout.      

DAY TRADING FOR INDICES & LARGE CAPS CHARTS.

Bonds were down today and are Below the Green Line.  

Crude Oil was up $0.09 today at $71.88.

MY TRADING DASHBOARD 
SWING TRADING CURRENT POSITIONS
DAY TRADING SETUPS
TRADE ALERTS
GREEN LINE CHARTS AT STOCKCHARTS
ARE YOUR INVESTMENTS ABOVE THE GREEN LINE?
GREEN LINE RULES
ETF SECTOR ROTATION SYSTEM   
New TOP 100 LIST Updated Ju1 1, 2023

Many like to Buy the Swing Trades just before the Close, if the Money Wave is going to create a Buy Signal (Closing > 20 and up out of the Green Zone). Don’t Buy if the Security has already popped up too much. Money Wave Buy Signals are usually good for a 3-6 % move in a few days.

We will “Not Log” trades if the Reward/Risk is not at least 2:1, or Low Volume. These have more risk.   

Related Post

– PBR

Subscribe to Our Newsletter

AGL Logo

Get our eBook Now!

Candlestick - A Swing Traders Friend

We don’t spam! Read our privacy policy for more info.

You’ve been successfully subscribed to our newsletter!

Voted #1 at Stock Charts

SH Chart
Inverse S&P 500 Fund (SH) will have a Money Wave Buy today.

Help Us Help Animals

Help Us Help Animals

Recent Comments

  • Market Breadth Indicators: A Trader’s Guide to Early Trend Detection on Backtesting: Definition and How a Trading Strategy Backtest Works
  • Island Reversal Pattern: Definition and Formation Explained on Double Top Pattern: How to Identify and Trade This Reversal Signal
  • Channel Pattern Guide: What It Is and Why It Matters on A Guide to Forecasting Using Moving Averages
  • What Is a Broadening Bottom Chart Pattern? Full Guide on Bull vs. Bear Market: An Investor’s Guide to Market Phases
  • ATGL Weekly Money Flow - 2025-05-11 on ATGL Top Pick of the Week! Apr 6, 2025

Become a Green Liner!

Help me make more Money in the Stock Market.

ON ATGL

  • DashBoard
  • Weekly Commentary
  • Daily Buy / Sell Signals
  • Day Trade Setup
  • Trading Rooms

Design & Develop By Pixelvect

STRATEGIES

  • Swing Trading
  • ATGL Pick of the Week
  • Dividend Growth
  • ETF Sector Rotation
  • Dogs of the Dow

HELP

  • ATGL Trading Rules
  • FAQ
  • Account Maintenance
  • Contact US
  • Join

FOLLOW US

Instagram Linkedin Twitter Facebook

© COPYRIGHT 2024 · ABOVETHEGREENLINE.COM · ALL RIGHTS RESERVED · PRIVACY · TERMS · CONTACT · WATCHLIST · CURRENT