
5/7/2023 Markets were slightly lower for the week, as several regional Banks dropped more. The S&P 500 & DOW 30 Indices dropped down again to the 50-day averages (Red Lines) and then bounced up. Now the S&P 500 & DOW 30 must exceed last week’s highs for the rally since the March low to continue.
The FED Tightened another 1/4 point higher on short term Interest Rates, pushing Fed Funds to 5%. Now many are hoping that the FED has finished Tightening, and the Economy will pick up speed. But the FEAR Index (VIX) is under $17, telling us that Dumb Money is now panic Buying call options (expecting a huge rally).
We will continue to Buy strong investments on pull-backs, and not worry about it. Low Volume is the only concern.
If you continue to Follow the Green Line System, your Money should flow into the Strongest areas and your account value should be able to grow in both Bull and Bear Markets. Follow the MONEY, not the MEDIA.
_____________________________________________________________________________________________
For the week the Dow was down 1.26%, the S&P 500 was down 0.79% and the NASDAQ 100 was up 0.10%. Most of the major Indices have a Relative Strength below 80, so you should currently own the stronger Securities here.
The Inflation Index (CRB) was down 2.44% for the week and is Below the Green Line, indicating Economic Contraction.
Bonds were down 1.23% for the week, and are Below the Green Line, indicating Economic Expansion.
The US DOLLAR was down 0.40% for the week and is Below the Green Line.
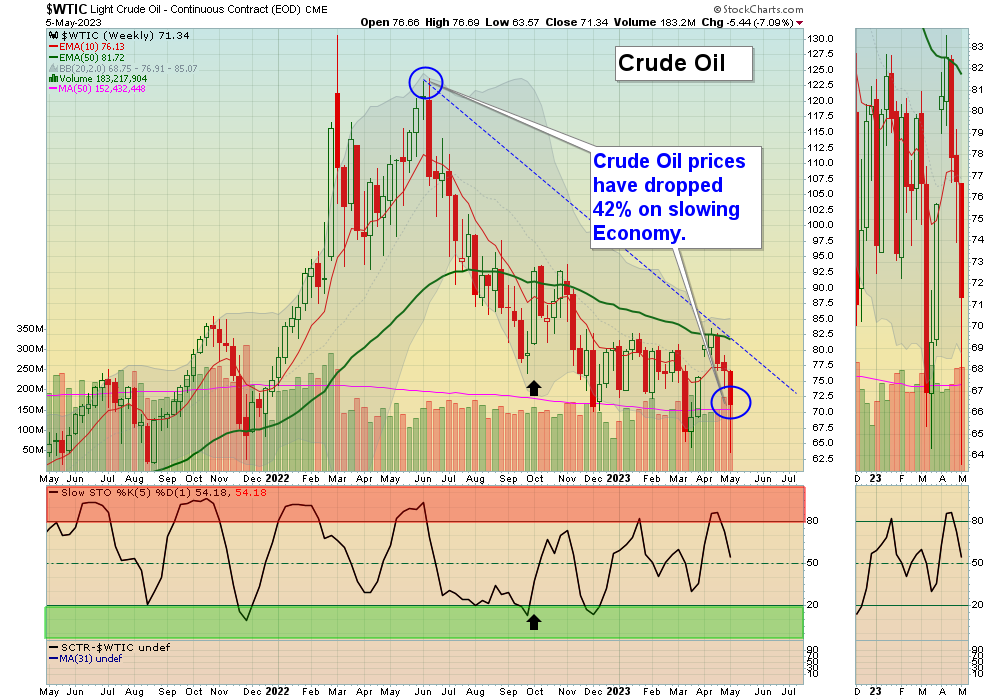
Crude Oil was down 7.09% for the week at $71.34 and GOLD was up 1.29% at $2024.80.
We are now doing micro Day Trades on our new Discord site (free), and now have 178 members. Please join for mobile notifications during the day. Other methods of notification have been too Slow. Also, please check our our Live Streaming on YouTube during Market hours.
More action this week on the Day Trading Scrolling Charts, and DAY TRADING CHARTS FOR INDICES & LARGE CAPS.
_____________________________________________________________________________________________
MONEY BUYS SOON:
We are in now in 6 logged Swing Trading Positions for the Short & Medium Term. There are 6 investments on the Short Term Watch List.
Be patient and WAIT for Green Zone Buy Signals!
LONG TERM INVESTMENTS:
Long Term Scrolling Charts (Real Time)
CHWY CHEWY INC. Buy above $52.88 with High Volume with a 3% Trailing Sell Stop Loss below it.
EDU ORIENTAL EDUCATION GROUP Buy above $46.63 with High Volume with a 3% Trailing Sell Stop Loss below it.
PINS PINTEREST INC. Buy above $29.27 with High Volume with a 3% Trailing Sell Stop Loss below it.
SH INVERSE S&P 500 FUND Buy above $17.71 with High Volume with a 3% Trailing Sell Stop Loss below it.
SHOP SHOPIFY INC. Broke Out this week above $54.67. Wait for the next Daily Money Wave Buy Signal.
TAL TAL EDUCATION GROUP Buy above $10.45 with High Volume with a 3% Trailing Sell Stop Loss below it.
__________________________________________________________________________________________
My Trading Dashboard
Swing Trading Scrolling Charts
Day Trading Scrolling Charts
Click for Watch Lists
Click for Current Positions
Click for Closed Positions
Updated Top 100 List May 1, 2023
Dividend Growth Portfolio
Updated ETF Sector Rotation System
Dogs of the DOW System
Long Term Strategy for IRAs & 401k Plans
CNN Fear & Greed Index
Scrolling Stage Chart Investing Charts
Alert! Market Risk is Medium (YELLOW). The probability of successful Short Term Trades is better, when the % of stocks above the 50-day avg. is below 20.
Tell your Friends about the Green Line, and Help Animals.
________________________________________________________________________________
QUESTION: Arvind writes “I joined Green Line 2 days ago. How do I get a chart of my chosen ticker symbol?”
ANSWER: Hi Arvind, if you go down to the link on the Daily emails: ARE YOUR INVESTMENTS ABOVE THE GREEN LINE?
you can pull up your own Charts.
Thank you,
ATGL
Related Post
– CHWY