Above the Green Line -01
  • Market Insights
        • Commentary
          • Daily
          • Weekly
        • BUY / SELL SIGNALS
          • Trade Posts
          • Recent Trade Alerts
          • Recent Day Trades
        • BLOGROLL
          • Dividend Growth Blog
          • ETF Sector Blog
          • Dow Dogs
          • TPOW Blog
  • Strategies
        • SWING TRADING
          • Current Positions
          • Watchlists
          • Closed Positions
          • Candidates - TOP 100
          • Specialty Stocks
        • WEEKLY STOCK PICK
          • TPOW Charts
          • TPOW Performance
          • TPOW Strategy Guide
          • TPOW Performance Dashboard
        • DAY TRADING
          • Watch List
        • ATGL DASHBOARD
        • ETF STRATEGIES
          • ETF Sector Rotation
          • ETF Sector Portfolio
        • DIVIDEND GROWTH
          • Dividend Growth Portfolio
          • Dividend Calendar
        • DOGS OF THE DOW
          • Dogs of the Dow Portfolio
          • DOW 5 Portfolio
  • Markets
        • US MARKET
          • Commodities
          • Energy
          • Precious Metals
          • Volatility
        • GLOBAL MARKETS
          • Market Indices
          • Economic Calendar
          • FOREX Heat Map
          • FOREX Cross Rates
          • Crypto Currency Market
  • Investing
    • Discord Community
    • Dashboard
  • Resources
        • ARTICLES
          • Dividend Growth Model Articles
          • ETF Articles
          • Investment Strategies Articles
          • Market and Economic Insights
          • Stock Trade Articles
          • Stock Reviews
        • TOOLS
          • Stock Scanners
          • Charting Software
          • Brokerage Firms
        • STOCK CHARTS
          • Key Components
          • Reading Charts
          • Drawing Stock Charts
          • Identifying Trends
        • RETIREMENT PLANNING
  • About
    • Contact Us
    • How to Win
    • #1 At Stockcharts
    • Disclaimer
    • FAQ
  • Log In
  • Subscribe

February 1, 2023

Money Wave Alert! Feb 1, 2023

SPX Chart
The S&P 500 Index was able to make a higher high and break 4100.

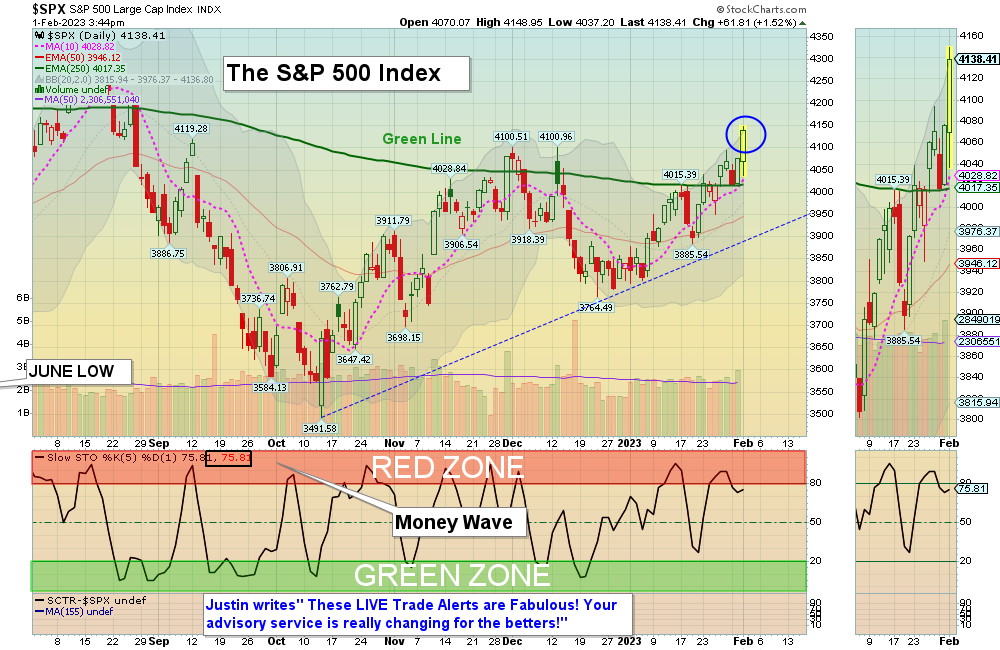
Markets were higher today as the Indices are retesting last week’s highs again. The S&P 500, Small Caps, and NASDAQ 100 Indices made slightly higher highs as the FED only raised short term Interest Rates 1/4 point this time. The Leaders and Indices are back up in the Red Zones (probably too late to Buy for the short term). The Market has not pulled back yet enough recently to get any good Money Wave Buy Signals (Greed is too High).. 

Please be patient and wait for Buy Signals for that are still Above the Green Lines.  SOON – CHARTS  The best moves happen when the S&P 500 Index is also coming up out of the Green Zone. 

_________________________________________________________________________________________________________________

BUYS TODAY   2/1/2023    

ARDX      ARDELYX INC.     Money Wave Buy Signal today, but ARDX will not be bought or Logged as the Volume is below average of 9.5 MIL.

GDX      GOLD MINERS FUND     Money Wave Buy Signal today, but GDX will not be bought or Logged as the Volume is below average of 25 MIL.

UAL      UNITED AIRLINES INC.     Money Wave Buy Signal today, but UAL will not be bought or Logged as the Volume is below average of 8.6nMIL.

BUYS TOMORROW                

ROIV      ROIVANT SCIENCES LTD      Buy above $8.79 with High Volume with a 3% Trailing Sell Stop Loss below it.     

TCOM      TRIP.COM GROUP      Wait for Money Wave Close > 20 with High Volume. 

Shop for a better price earlier in the day with Triple Buy Signal, on the same day that a Daily Money Wave Buy Signal will occur.  

BUYS SOON            

TSLQ      INVERSE TESLA FUND      Wait for Money Wave Close > 20 with High Volume. (2nd Buy Signal soon).     

Please be patient and Wait for Money Wave Buy Signals.  We will email you when they are ready. Follow on the WATCH LIST.   

SELLS TODAY      

ISEE      IVERIC BIO INC.     The Target was Hit at $23 for a 13.4 % Gain. This trade was not logged.

TAL      TAL EDUCATION GROUP      EXIT if it is going to Close below Support of $7.31. This trade was not logged.     

TSLQ      INVERSE TESLA FUND      LOWER the Sell Stop Loss below $47.50. Tesla Common Stock is still Below the Green Line with only 10 Relative Strength. Volume is also lower on TSLA, this time up.

________________________________________________________________________

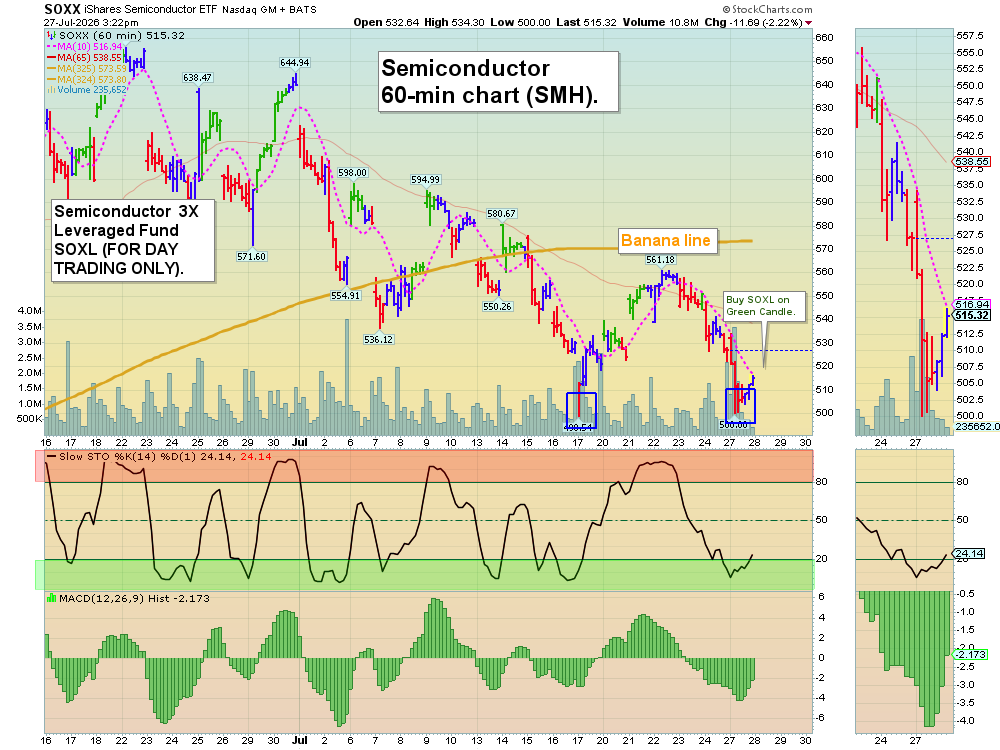
DAY TRADING SETUPS.  Follow our YouTube Live Stream for quick trades. Or look for Triple Buy Pops (3 Green Circles). Movers today:  AMD (+12%) SMMT (+14%) SOXL (+16%) & TARK (+8%).  ( Try out the New Side by Side layout.      

DAY TRADING FOR INDICES & LARGE CAPS CHARTS.

Bonds were up today but are Below the Green Line.  

Crude Oil was up $1.98 today at $76.89.

MY TRADING DASHBOARD 
SWING TRADING CURRENT POSITIONS
DAY TRADING SETUPS
TRADE ALERTS
GREEN LINE CHARTS AT STOCKCHARTS
ARE YOUR INVESTMENTS ABOVE THE GREEN LINE?
GREEN LINE RULES
ETF SECTOR ROTATION SYSTEM   
New TOP 100 LIST Updated Feb 1, 2023

Many like to Buy the Swing Trades just before the Close, if the Money Wave is going to create a Buy Signal (Closing > 20 and up out of the Green Zone). Don’t Buy if the Security has already popped up too much. Money Wave Buy Signals are usually good for a 3-6 % move in a few days.

We will “Not Log” trades if the Reward/Risk is not at least 2:1, or Low Volume. These have more risk.

Related Post

– ARDX

Subscribe to Our Newsletter

AGL Logo

Get our eBook Now!

Candlestick - A Swing Traders Friend

We don’t spam! Read our privacy policy for more info.

You’ve been successfully subscribed to our newsletter!

Voted #1 at Stock Charts

SH Chart
Inverse S&P 500 Fund (SH) will have a Money Wave Buy today.

Help Us Help Animals

Help Us Help Animals

Recent Comments

  • Market Breadth Indicators: A Trader’s Guide to Early Trend Detection on Backtesting: Definition and How a Trading Strategy Backtest Works
  • Island Reversal Pattern: Definition and Formation Explained on Double Top Pattern: How to Identify and Trade This Reversal Signal
  • Channel Pattern Guide: What It Is and Why It Matters on A Guide to Forecasting Using Moving Averages
  • What Is a Broadening Bottom Chart Pattern? Full Guide on Bull vs. Bear Market: An Investor’s Guide to Market Phases
  • ATGL Weekly Money Flow - 2025-05-11 on ATGL Top Pick of the Week! Apr 6, 2025

Become a Green Liner!

Help me make more Money in the Stock Market.

ON ATGL

  • DashBoard
  • Weekly Commentary
  • Daily Buy / Sell Signals
  • Day Trade Setup
  • Trading Rooms

Design & Develop By Pixelvect

STRATEGIES

  • Swing Trading
  • ATGL Pick of the Week
  • Dividend Growth
  • ETF Sector Rotation
  • Dogs of the Dow

HELP

  • ATGL Trading Rules
  • FAQ
  • Account Maintenance
  • Contact US
  • Join

FOLLOW US

Instagram Linkedin Twitter Facebook

© COPYRIGHT 2024 · ABOVETHEGREENLINE.COM · ALL RIGHTS RESERVED · PRIVACY · TERMS · CONTACT · WATCHLIST · CURRENT