
1/8/2023 Markets were higher for the week after bouncing up from last week’s low. The major Indices are retesting the Oct. lows, and the Markets need to make a higher low than in October to become more “bullish”. The major Tax Loss selling at the end of the year is over for the weaker stocks.
A big 5.64% rally on Bonds and a 4.65% drop on Inflation Index (CRB) this week indicates that the Economy has slowed down. For the Markets to go higher, we need the FED to realize this and start talking about ending their tightening. Investors should become much more Bullish when the FED finally announces the End of Tightening.
If you continue to Follow the Green Line System, your Money should flow into the Strongest areas and your account value should be able to grow in both Bull and Bear Markets. Follow the MONEY, not the MEDIA.
________________________________________________________________________________________________________________________________________________
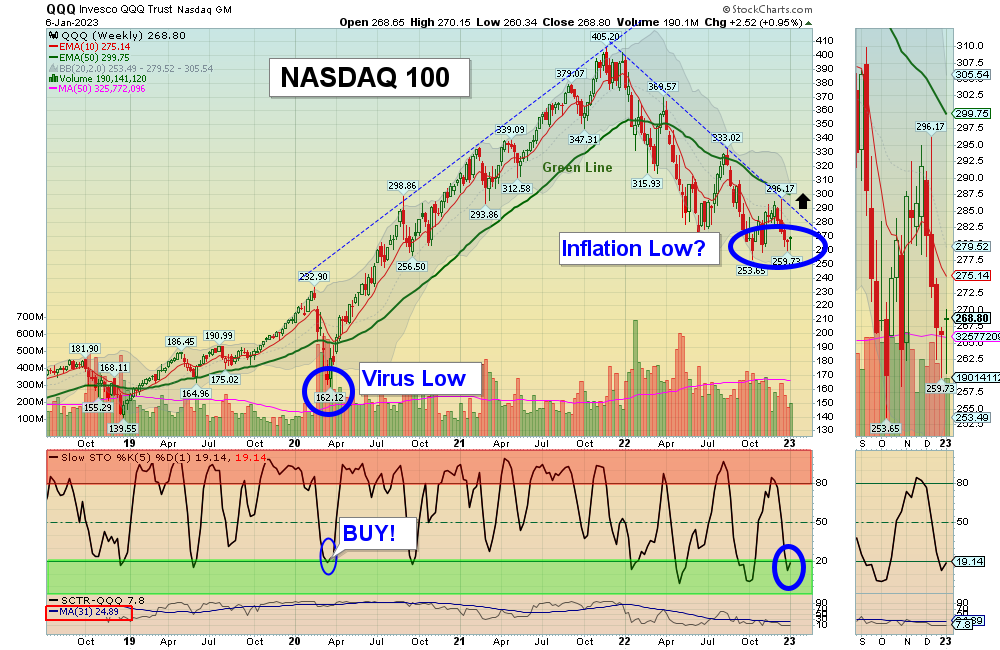
For the week the Dow was up 1.49%, the S&P 500 was up 1.48% and the NASDAQ 100 was up 0.95%. Most of the major Indices do not have Relative Strength above 80, so you should currently own the stronger Securities here.
The Inflation Index (CRB) was down 4.65% for the week and is Below the Green Line, indicating Economic Contraction.
Bonds were up 5.64 % for the week, and are Below the Green Line, indicating Economic Expansion.
The US DOLLAR was up 0.37% for the week and is Below the Green Line.
Crude Oil was down 8.09% for the week at $73.77 and GOLD was up 2.38% at $1869.70.
More action this week on the Day Trading Scrolling Charts.
DAY TRADING CHARTS FOR INDICES & LARGE CAPS.
We have not had many intra-day Trade Alert signals lately as the Volume has been too Low with the Buy Signals. These low Volume Buy Signals tend to pop up and quickly fade back down. We like to see High Volume on rallies.
_____________________________________________________________________________________________
MONEY WAVE BUYS SOON:
We are in now in 7 logged Current Positions for the Short & Medium Term. There are 3 investments on the Short Term Watch List.
Be patient and WAIT for Green Zone Buy Signals!
LONG TERM INVESTMENTS: (It is still hard to find many Long Term now because most normal Investments no longer have 80 Relative Strength required.)
Long Term Scrolling Charts (Real Time)
CROX CROX INC. Not quite down to a Daily Money Wave Buy Signal. Please wait.
HRB H&R BLOCK INC. Wait for Weekly Money Wave Close > 20 with High Volume.
SH INVERSE S&P 500 FUND Buy above $17.71 with High Volume with a 3% Trailing Sell Stop Loss below it.
TWNK HOSTESS BRANDS Buy on the next Daily Money Wave Buy Signal.
UUP US DOLLAR FUND Buy above $28.33 with High Volume with a 3% Trailing Sell Stop Loss below it.
VIPS VIPSHOP HOLDINGS Buy on the next Daily Money Wave Buy Signal.
______________________________________________________________________________________________________
My Trading Dashboard
Swing Trading Scrolling Charts
Day Trading Scrolling Charts
Click for Watch Lists
Click for Current Positions
Click for Closed Positions
Updated Top 100 List Jan 2, 2023
Dividend Growth Portfolio
Updated ETF Sector Rotation System
Dogs of the DOW System
Long Term Strategy for IRAs & 401k Plans
CNN Fear & Greed Index
Scrolling Stage Chart Investing Charts
Alert! Market Risk is Medium (YELLOW). The probability of successful Short Term Trades is better, when the % of stocks above the 50-day avg. is below 20.
Tell your Friends about the Green Line, and Help Animals.
________________________________________________________________________________
QUESTION: Jose M writes “Morning, I seem to have difficulties on finding the Money Wave chart on the ETFs. Thanks.”
ANSWER: First go to MY TRADING DASH BOARD. Then the Charts with the Money Waves can be pulled up by clicking on the Symbol of the Investment on the Watch List or Current Positions links in every Daily email.
The Money Wave is the Red and Green Zone on the bottom part of the Chart. Buy when the Money Wave has gone down into the Green Zone, and then turns up above 20.
Related Post
– CROX


