Above the Green Line -01
  • Market Insights
        • Commentary
          • Daily
          • Weekly
        • BUY / SELL SIGNALS
          • Trade Posts
          • Recent Trade Alerts
          • Recent Day Trades
        • BLOGROLL
          • Dividend Growth Blog
          • ETF Sector Blog
          • Dow Dogs
          • TPOW Blog
  • Strategies
        • SWING TRADING
          • Current Positions
          • Watchlists
          • Closed Positions
          • Candidates - TOP 100
          • Specialty Stocks
        • WEEKLY STOCK PICK
          • TPOW Charts
          • TPOW Performance
          • TPOW Strategy Guide
          • TPOW Performance Dashboard
        • DAY TRADING
          • Watch List
        • ATGL DASHBOARD
        • ETF STRATEGIES
          • ETF Sector Rotation
          • ETF Sector Portfolio
        • DIVIDEND GROWTH
          • Dividend Growth Portfolio
          • Dividend Calendar
        • DOGS OF THE DOW
          • Dogs of the Dow Portfolio
          • DOW 5 Portfolio
  • Markets
        • US MARKET
          • Commodities
          • Energy
          • Precious Metals
          • Volatility
        • GLOBAL MARKETS
          • Market Indices
          • Economic Calendar
          • FOREX Heat Map
          • FOREX Cross Rates
          • Crypto Currency Market
  • Investing
    • Discord Community
    • Dashboard
  • Resources
        • ARTICLES
          • Dividend Growth Model Articles
          • ETF Articles
          • Investment Strategies Articles
          • Market and Economic Insights
          • Stock Trade Articles
          • Stock Reviews
        • TOOLS
          • Stock Scanners
          • Charting Software
          • Brokerage Firms
        • STOCK CHARTS
          • Key Components
          • Reading Charts
          • Drawing Stock Charts
          • Identifying Trends
        • RETIREMENT PLANNING
  • About
    • Contact Us
    • How to Win
    • #1 At Stockcharts
    • Disclaimer
    • FAQ
  • Log In
  • Subscribe

March 4, 2022

Money Wave Alert! Mar 4, 2022

PBF Chart
The Buy Signal on PBF Energy today was good for 15 %.

Markets were lower again today as the Indices are re-testing last week’s Lows. So far all is well and the low Volume could indicate that the Selling is drying up. the S&P 500 is the only major Index that is back above the Green Line. Many are waiting on the S&P 500 to Close above the Red Line (50-day avg.) before getting back in.

Disciplined traders are Buying only the limited number of Leaders, so most of the Leaders were over-bought. Currently the DOW 30. NASDAQ 100 and Small Cap Indices are still Below the Green Lines, so we are being cautious now. 

FEAR is usually a good time to Buy. But we don’t want to be the only ones Buying, so we are waiting on improved Buying Volume. 

New Subscribers:  Many are not buying with the Russia situation going on now, as the Volume is low. We need High Volume for better moves up. Please be patient and Wait for more Buy Signals soon. BUYS SOON – CHARTS  The best moves are when the S&P 500 Index is also coming up out of the Green Zone.

BUYS TODAY    3/4/2022    

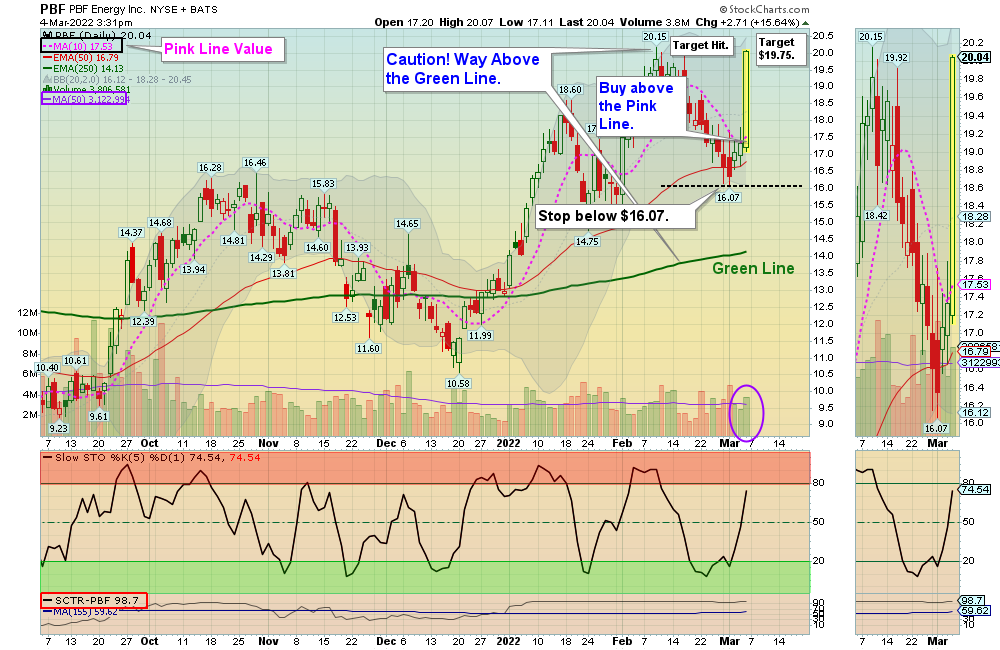
PBF      PBF ENERGY CORP.      Shot up above the Pink Line of $17.34. PBF has already hit the Target of $19.75 for a 13.5 % Gain, but the Volume was not High. Don’t Take a Loss. 

BUYS TOMORROW – JUMP START STOCKS  Shop for a better price earlier in the day. Only use Jump Start on the same day that a Daily Money Wave Buy Signal will occur.    

NONE TODAY

BUYS SOON – CHARTS      WATCH LIST

BTI       BRITISH AMER TOBACCO PLC      Money Wave must Close in the Green Zone.

IAU       GOLD FUND      Target was already Hit. AVOID.   

KAR      KAR AUCTION SERVICES      Money Wave must Close in the Green Zone.

MAR      MARRIOTT INT’L.      Money Wave must Close in the Green Zone. (2nd Buy Signal soon).

Please be patient and wait for Money Wave Buy Signals.  We will email you when they are ready. Follow on the WATCH LIST.      
The Leaders are Way Above the Green Lines (all Investments eventually return to their Green Lines).    

SELLS TODAY     

EXPE      EXPEDIA INC.    Lower Sell Stop Loss below the Green Line until it bottoms.

MAR      MARRIOTT INT’L.      EXIT if it is going to Close below Support of $162.95. This trade was not logged.

_________________________________________________________________________________________________________________

DAY TRADING SETUPS.  A few Triple Buy Pops today: SQQQ (+6%) TZA (+6%) & VIV (+11%).  Try out the New Side by Side layout.   

DAY TRADING FOR INDICES & LARGE CAPS CHARTS.

Bonds  were up again today, but are Below the Green Line. 

Crude Oil was up $7.50 today at $115.14, a New High.

_________________________________________________________________________________________________________________

MY TRADING DASHBOARD 
SWING TRADING CURRENT POSITIONS
DAY TRADING SETUPS
TRADE ALERTS
ARE YOUR INVESTMENTS ABOVE THE GREEN LINE?
GREEN LINE RULES
ETF SECTOR ROTATION SYSTEM   
New TOP 100 LIST Updated Mar 1, 2022

Many like to Buy the Swing Trades just before the Close, if the Money Wave is going to create a Buy Signal (Closing > 20 and up out of the Green Zone).

Don’t Buy if the Investment has already popped up too much. Money Wave Buy Signals are usually good for a 3-6 %  move in a few days.

We will “Not Log” trades if the Reward/Risk is not at least 2:1, or Low Volume. These have more risk.


HAVE A NICE WEEKEND!

Related Post

– PBF

Subscribe to Our Newsletter

AGL Logo

Get our eBook Now!

Candlestick - A Swing Traders Friend

We don’t spam! Read our privacy policy for more info.

You’ve been successfully subscribed to our newsletter!

Voted #1 at Stock Charts

SH Chart
Inverse S&P 500 Fund (SH) will have a Money Wave Buy today.

Help Us Help Animals

Help Us Help Animals

Recent Comments

  • Market Breadth Indicators: A Trader’s Guide to Early Trend Detection on Backtesting: Definition and How a Trading Strategy Backtest Works
  • Island Reversal Pattern: Definition and Formation Explained on Double Top Pattern: How to Identify and Trade This Reversal Signal
  • Channel Pattern Guide: What It Is and Why It Matters on A Guide to Forecasting Using Moving Averages
  • What Is a Broadening Bottom Chart Pattern? Full Guide on Bull vs. Bear Market: An Investor’s Guide to Market Phases
  • ATGL Weekly Money Flow - 2025-05-11 on ATGL Top Pick of the Week! Apr 6, 2025

Become a Green Liner!

Help me make more Money in the Stock Market.

ON ATGL

  • DashBoard
  • Weekly Commentary
  • Daily Buy / Sell Signals
  • Day Trade Setup
  • Trading Rooms

Design & Develop By Pixelvect

STRATEGIES

  • Swing Trading
  • ATGL Pick of the Week
  • Dividend Growth
  • ETF Sector Rotation
  • Dogs of the Dow

HELP

  • ATGL Trading Rules
  • FAQ
  • Account Maintenance
  • Contact US
  • Join

FOLLOW US

Instagram Linkedin Twitter Facebook

© COPYRIGHT 2024 · ABOVETHEGREENLINE.COM · ALL RIGHTS RESERVED · PRIVACY · TERMS · CONTACT · WATCHLIST · CURRENT