
1/03/2021 Markets were higher for the week on low Holiday Volume. Many of the major Indices are on Highs but are very over-bought.
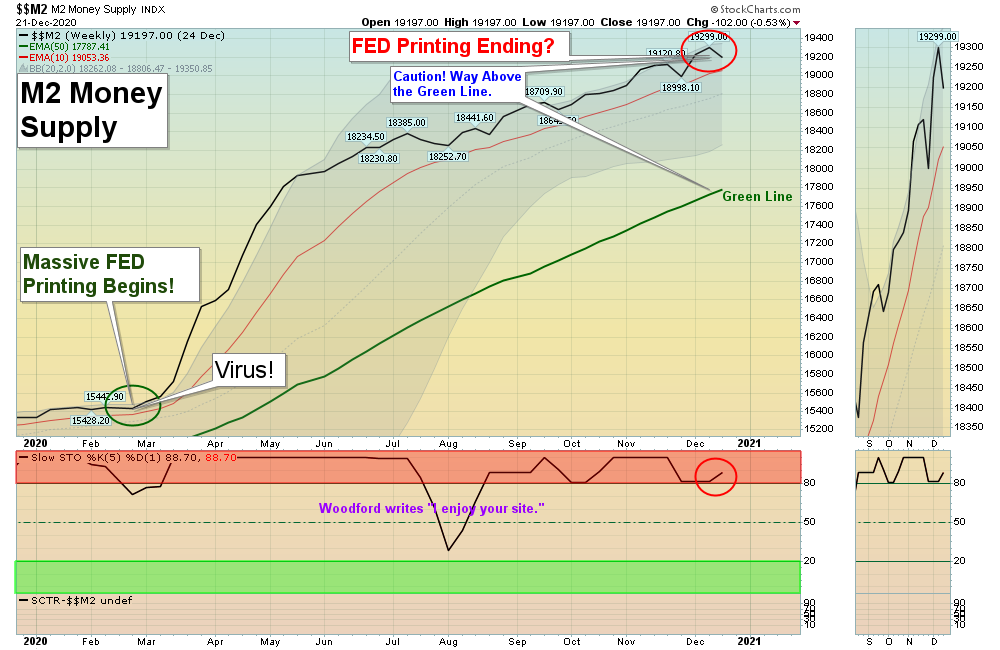
Much of the Rally since March is from FED Printing (see Chart above). When the latest Virus surge peaks, the FED should reduce the amount of Funds that they are pouring into the Money Supply to control inflation. Pumping Money can be inflationary and the Inflation Index ($CRB) was up 4.84 % in December and could be bottoming. Higher Inflation would normally put pressure on Bond Prices, which could be the catalyst for the Markets to return to their Green Lines again.
Historically the Markets are too far Above the Green Lines to justify a 2:1 Reward / Risk Ratio. So prudent Investors who like to Buy on FEAR should be raising Cash up here.
2020 Green Line Trading Results:
- Swing Trading: There were 100 completed Short Term trades, average / trade +6.1 %. The total was 609% (before taxes and commissions).
- ETF Sector Rotation: Annual return of 26.76 % versus 16.3 % for S&P 500 Index.
- Dividend & Growth: Up 27 % + 4% Dividends from the inception in March 2020.
For the week the Dow was up 1.25%, the S&P 500 was up 1.32%, and the Nasdaq 100 was up 1.35%. The Long Term Trend for the Indices is up.
The Inflation Index (CRB) was up 1.36% for the week and is Above the Green Line, indicating Economic Expansion.
Bonds were up 0.44% for the week, and are Above the Green Line, indicating Economic Weakness.
The US DOLLAR was down 0.37% for the week, a New Low.
Crude Oil was up 0.60% for the week at $48.52 and GOLD was up 0.63% at $1895.10.
_____________________________________________________________________________________________
MONEY WAVE BUYS SOON
We are currently in 4 logged Current Positions, for the Short & Medium Term. There are 7 Investments on the Short Term Watch List.
Be patient and WAIT for Green Zone Buy Signals!
______________________________________________________________________________________________
LONG TERM INVESTMENTS (Most of the Leaders are back up in the Weekly Red Zones.)
Buy the Leading Investments that are down near the Weekly Green Zones.
AR ANTERO RESOURCES Wait for the next Daily Money Wave Buy Signal.
BNTX BIONTECH SE Buy if it Closes above the Daily Pink Line on High Volume.
CRON CRONOS GROUP Buy if it Closes above $9.00 on High Volume.
CYH COMMUNITY HEALTH Buy if it Closes above $7.90 on High Volume.
RIOT RIOT BLOCKCHAIN Wait for the next Daily Money Wave Buy Signal.
ZM ZOOM VIDEO Wait for Close Above the Daily Red Line.
______________________________________________________________________________________
Click for Watch Lists
Click for Current Positions
Click for Closed Positions
New: My Trading Dashboard
ETF Sector Rotation System On Dec 31, 2020, the 5 Funds were Sold on the Close. On Jan 4, 2020, 20 % of the account value will be allocated into these 5 Funds: SPY, EEM, SLV, IWM & QQQ on the Close. (Or you can just swap EFA for IWM, and try for 20 % allocation in each of 5 Funds).
Dogs of the DOW System All positions were Close and New ones will be determined on Monday Jan 4.
Long Term Strategy for IRAs & 401k Plans
Alert! Market Risk is HIGH (Red Zone). The probability of successful Short Term Trades is better, when the % of stocks above the 50-day avg. is below 20.
Tell your Friends about the Green Line, and Help Animals.
___________________________________________________________________________________________
QUESTION: Craig writes “What is the signal that MRNA (Moderna Inc.) has bottomed? How do we know when it’s safe to get back in?”
ANSWER: It’s hard to measure Human Emotion precisely. But if you Sold MRNA correctly up around $170, when you Buy it back?
Or has Tammy been Flushed out yet? Down 43 % in a month is tough on Tammy.
Weekly Chart says it is still too early to bottom, but it still has a 93 Relative Strength, so the Shorts should get Blown soon.
It will probably have Double Bottom, or “W” pattern, so no rush right now.
Good trading and tell your friends!
AGL