Above the Green Line -01
  • Market Insights
        • Commentary
          • Daily
          • Weekly
        • BUY / SELL SIGNALS
          • Trade Posts
          • Recent Trade Alerts
          • Recent Day Trades
        • BLOGROLL
          • Dividend Growth Blog
          • ETF Sector Blog
          • Dow Dogs
          • TPOW Blog
  • Strategies
        • SWING TRADING
          • Current Positions
          • Watchlists
          • Closed Positions
          • Candidates - TOP 100
          • Specialty Stocks
        • WEEKLY STOCK PICK
          • TPOW Charts
          • TPOW Performance
          • TPOW Strategy Guide
          • TPOW Performance Dashboard
        • DAY TRADING
          • Watch List
        • ATGL DASHBOARD
        • ETF STRATEGIES
          • ETF Sector Rotation
          • ETF Sector Portfolio
        • DIVIDEND GROWTH
          • Dividend Growth Portfolio
          • Dividend Calendar
        • DOGS OF THE DOW
          • Dogs of the Dow Portfolio
          • DOW 5 Portfolio
  • Markets
        • US MARKET
          • Commodities
          • Energy
          • Precious Metals
          • Volatility
        • GLOBAL MARKETS
          • Market Indices
          • Economic Calendar
          • FOREX Heat Map
          • FOREX Cross Rates
          • Crypto Currency Market
  • Investing
    • Discord Community
    • Dashboard
  • Resources
        • ARTICLES
          • Dividend Growth Model Articles
          • ETF Articles
          • Investment Strategies Articles
          • Market and Economic Insights
          • Stock Trade Articles
          • Stock Reviews
        • TOOLS
          • Stock Scanners
          • Charting Software
          • Brokerage Firms
        • STOCK CHARTS
          • Key Components
          • Reading Charts
          • Drawing Stock Charts
          • Identifying Trends
        • RETIREMENT PLANNING
  • About
    • Contact Us
    • How to Win
    • #1 At Stockcharts
    • Disclaimer
    • FAQ
  • Log In
  • Subscribe

December 16, 2020

Money Wave Alert! Dec 16, 2020

GBTC Chart
Target was hit on the BitCoin Trust for 21.2 % Gain in 4 days.

Markets were mixed today as Investors wait for more Stimulus. Now the Markets need to exceed the recent Highs to remain Bullish. Volume is Low as Smart Money is not eager to Buy near Highs

The FED announced today that they would continue to Buy $120 Billion of Bonds monthly. This way they can mask Inflation down the road from too much Printing. The Leaders were very over-bought, as many Investors are waiting on a Stimulus Plan. Please be patient and WAIT for good setups in the Green Zones. 

New Subscribers: Markets will eventually come back down to the Green Zones for Money Wave Buys, so now we must be patient and wait for the Leaders to return pull back down. The better trades happen when the S&P 500 Index is also in the Green Zone (now about 2/3 of the way down there). 

Bonds  were down slightly today. 

Crude Oil was up $0.15 today at $47.77.

BUYS TODAY    12/16/2020     

NLS      NAUTILUS GROUP     Long Term Buy today if it Closes above the Pink Line of $17.64. Target is $26.00. EXIT if it is going to Close below Support of $16.12.

JUMP START: (Buy Signal should be very soon… Click on the Jump Start link for more info.)    

KODK      EASTMAN KODAK

____________________________________________________________________________________________________________

WATCH LIST

WATCH LIST CHARTS (Real Time)

AYRO      AYRO INC.      Buy above the Pink Line around $6.41 with a 5% Trailing Sell Stop Loss below it.      

CBAT      CBAK ENERGY TECH      Buy above $6.01 with a 5% Trailing Sell Stop Loss below it.     LUNINAR TECH

GPS      GAP INC     

LAZR      LUMINAR TECH

MRNA      MODERNA INC.      Money Wave must Close in the Green Zone.

TRIL      TRILLION THERA.      Buy above $12.60 with a 5% Trailing Sell Stop Loss below it.

UMC      UNITED MICRO

Money Wave Buys Signals Soon (3 Days-3 Weeks Short Term):   (Best to Buy these when the S&P 500 is also in the Green Zone.)       

These Investments will probably have a Money Wave Buy Signal soon. (Slow Stochastic Closing > 20) on today’s Close.      

Please be patient and wait for Money Wave Buy Signals.  We will email you when they are ready. Follow on the WATCH LIST.
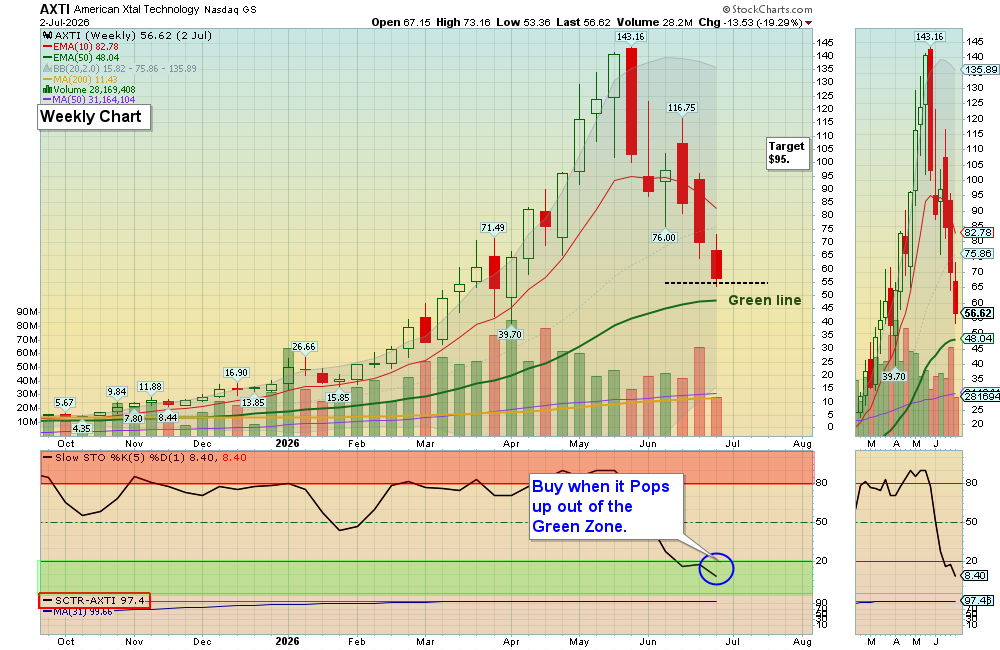
Emotions are very high now, so please do not Buy unless you are VERY NIMBLE.

The Leaders are Way Above the Green Lines (all Investments eventually return to their Green Lines).

____________________________________________________________________________________________________________

SELLS TODAY   

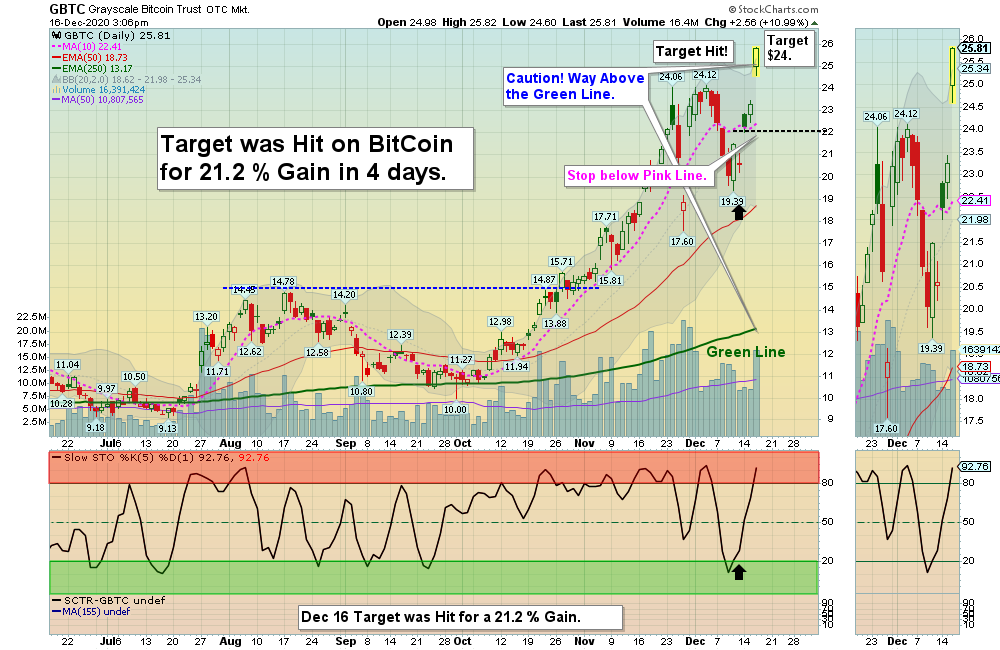
GBTC      GRAYSCALE BITCOIN TRUST      Target was Hit in 4 days for a 21.2 % Gain. Please send some profits to animals (aspca.org)     

PACB      PACIFIC BIOSCIENCES       EXIT if it is going to Close below the Pink Line around $20.98.  This trade was not logged.       

Click for  CURRENT POSITIONS  and adjust your Sell Stops.     
Click for  CURRENT POSITION CHARTS – Real Time  (Please check and adjust your Sell Stops).         
Click for  CLOSED POSITIONS,   
NEW:       MY TRADING DASHBOARD

PENNY STOCK WATCH LIST
ARE YOUR INVESTMENTS ABOVE THE GREEN LINE?
ETF SECTOR ROTATION SYSTEM   
TOP 100 LIST Updated Nov 4, 2020

Many like to Buy the day before, near the Close, if the Money Wave is going to create a Buy Signal (Closing > 20 and out of the Green Zone).

Don’t Buy if the Investment has already popped up too much. Money Wave Buys are usually good for a 3-6 %  move in a few days.

We will “Not Log” trades if the Reward/Risk is not at least 2:1.   


Related Post

– Money Wave Alert! Dec 15, 2020

Subscribe to Our Newsletter

AGL Logo

Get our eBook Now!

Candlestick - A Swing Traders Friend

We don’t spam! Read our privacy policy for more info.

You’ve been successfully subscribed to our newsletter!

Voted #1 at Stock Charts

SH Chart
Inverse S&P 500 Fund (SH) will have a Money Wave Buy today.

Help Us Help Animals

Help Us Help Animals

Recent Comments

  • Market Breadth Indicators: A Trader’s Guide to Early Trend Detection on Backtesting: Definition and How a Trading Strategy Backtest Works
  • Island Reversal Pattern: Definition and Formation Explained on Double Top Pattern: How to Identify and Trade This Reversal Signal
  • Channel Pattern Guide: What It Is and Why It Matters on A Guide to Forecasting Using Moving Averages
  • What Is a Broadening Bottom Chart Pattern? Full Guide on Bull vs. Bear Market: An Investor’s Guide to Market Phases
  • ATGL Weekly Money Flow - 2025-05-11 on ATGL Top Pick of the Week! Apr 6, 2025

Become a Green Liner!

Help me make more Money in the Stock Market.

ON ATGL

  • DashBoard
  • Weekly Commentary
  • Daily Buy / Sell Signals
  • Day Trade Setup
  • Trading Rooms

Design & Develop By Pixelvect

STRATEGIES

  • Swing Trading
  • ATGL Pick of the Week
  • Dividend Growth
  • ETF Sector Rotation
  • Dogs of the Dow

HELP

  • ATGL Trading Rules
  • FAQ
  • Account Maintenance
  • Contact US
  • Join

FOLLOW US

Instagram Linkedin Twitter Facebook

© COPYRIGHT 2024 · ABOVETHEGREENLINE.COM · ALL RIGHTS RESERVED · PRIVACY · TERMS · CONTACT · WATCHLIST · CURRENT