How to Profit from Stock Market Sector Rotation
By Author
Updated February 8, 2024
What is Sector Rotation?
Sector rotation is the movement of money that has been invested in stocks from one industry to another. In other words, traders and investors move their invested money from one industry to another as they attempt to predict the coming stages of the economic cycle. On a small scale, trends come and go in the market. One type of stock might be popular today and not so popular a month from now. On a large scale, many investors have great profitable success in moving their funds around due to the predictability of the overall economic cycle. In fact, The National Bureau of Economic Research illustrated in a study that economic cycles have been quite consistent since 1854. Thus, utilizing sector rotations comes in various forms: one could try to predict the next fad or one could try to predict the next recession. Many times, investors utilize both.
How to Profit from Stock Market Sector Rotation
A sector is a part of the economy. As such, an investor can view and invest in various sectors within the stock exchange. There are eleven primary sectors within the market: a materials sector, an industrials sector, an energy sector, a financial sector, a consumer discretionary sector, an information technology sector, a communications services sector, a real estate sector, a health care sector, a consumer staples sector, and a utilities sector. Within each sector are countless stocks from large corporations to small. To profit off of stock market sector rotation, an investor must anticipate the next cycle months in advance. Thus, in order to understand how to profit from stock market sector rotation, one must become aware of the market cycle and economic cycle stages.
The Market Cycle
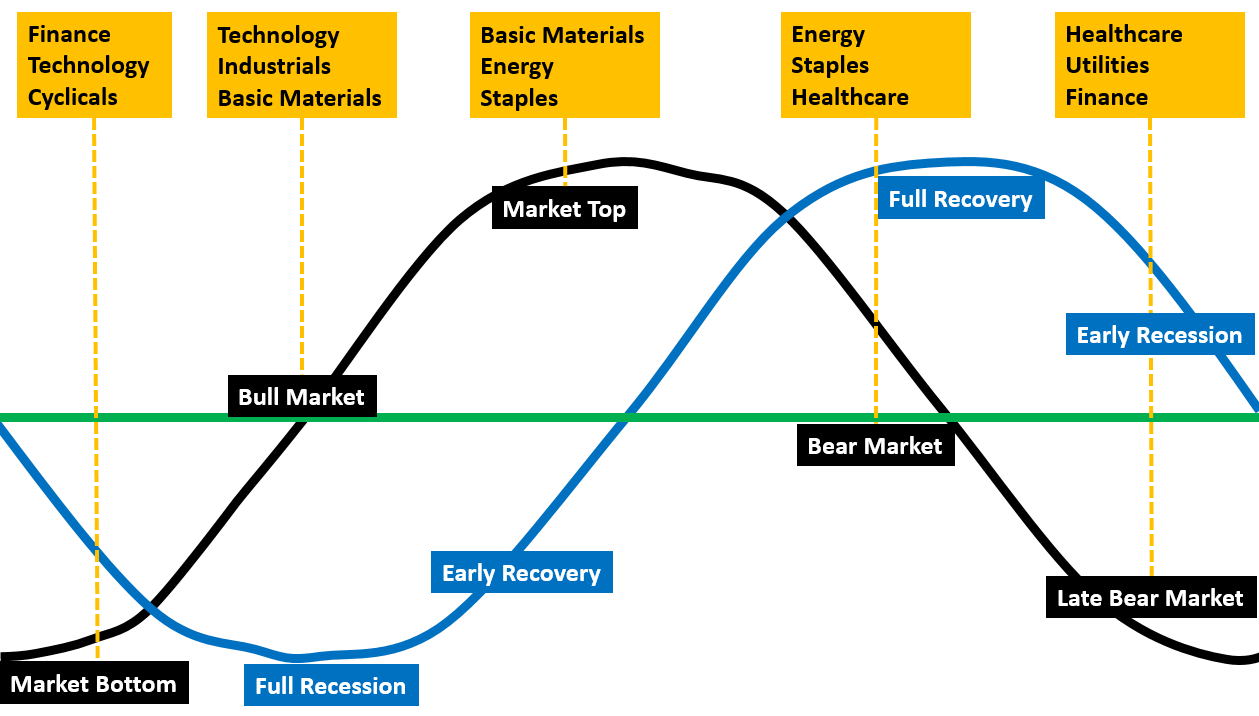
The market cycle does not move alongside the economic cycle; however, many times they move in anticipation of the economic cycle which is what makes its analysis so crucial. There are four stages to the market cycle. The first is referred to as the “market bottom” where a long-term low is reached. The second is “bull market” where a market rallies from the low. The third is “market top” where a long-term high is reached. And finally, the fourth is “bear market” where the market drops from its high. As previously mentioned, the market cycle attempts to predict the economic cycle anywhere from three to six months into the future. You may have noticed in the recent months after COVID-19 began plaguing the globe, the market rallied all the while the U.S. economy was very much in a recession. It is crucial to never conflate the conditions of the economy to the conditions of the market. The market looks ahead while the economy trails behind.
The Economic Cycle
Similar to the market cycle, there are four main stages of the economic cycle. The first is called “full recession” which basically signifies that things are not going well. During a full recession stage, the GDP is retracting, interest rates are dropping, and it is hard for many people to find or keep jobs. The second stage of the economic cycle is referred to as “early recovery” which alludes to exactly what it sounds like it does: things are beginning to recover from a full recession. During early recovery, production grows, consumer expectations rise, and interest rates bottom. The third stage of the economic cycle is “late recovery” where interest rates might rise exponentially, production flattens, and consumer expectations decline. The final stage of the economic cycle is known as “early recession”. During the early recession phase, the economy is not in great shape, production falls, interest rates peak, and consumer expectations drop to their lowest point.
Within each economic cycle stage, different sectors become profitable. During the full recession stage, transports, technology, and industrials have historically been profitable. During the early recovery stage, industrials, basic materials, and energy have been known to be profitable. During the late recovery stage, energy, consumer staples, and services have historically given investors returns. And lastly, during the early recession stage, services, utilities, and transports have been profitable. You may notice that the last profitable sector carries on to the next economic cycle stage. This is because that sector becomes profitable toward the end of the previous stage and the beginning of the new stage.
Strategy at ATGL
As previously discussed, different sectors of the economy tend to do better than others as the economy moves onward. Investors who seek to beat the market using sector rotation may spend countless hours reading informational articles research reports. At Above The Green Line, we believe in a simpler strategy that involves using ETF’s that are focused on certain sectors. By investing in diversified ETF’s, investors can take advantage of uptrends in certain sectors and reduce their losses on other sectors.
Here is our Green Line Strategy:
Own the strongest 5 ETFs based on their volume and their 1 year Relative Strength
The ETF must be Above the Green Line (250-day ema average), or move to Money Market (CASH)
Every three months rotate to the Strongest ETFs
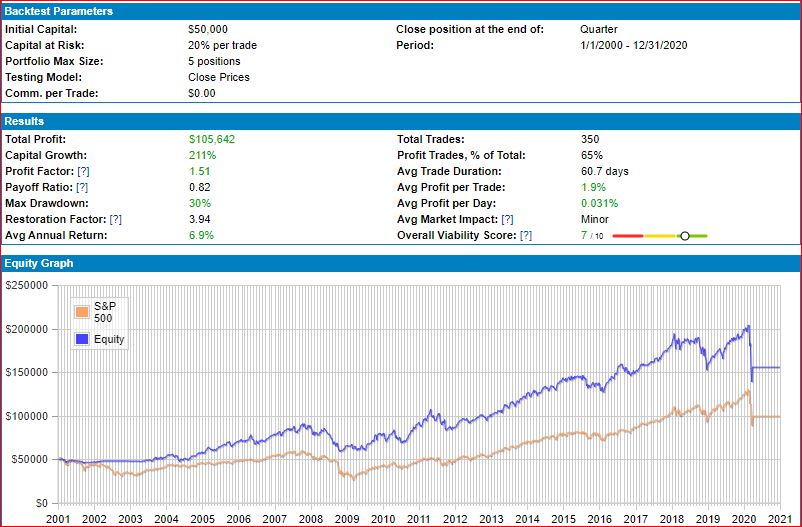
Below is a simulated backtest of the ATGL ETF Rotation System (Equity in blue) compared to the S&P 500 Index for the last 20 years. Results are NOT actual and may not be similar in the future.
Conclusion
Overall, sector rotation involves anticipating which corporations will become successful in the next stage of the economic cycle. Understanding both the market cycle and the economic cycle carries great importance when attempting to master sector rotation. Their stages highlight a strategy, which if used correctly, can be quite profitable for investors. The principle idea behind sector rotation is to sell highly favored ETF’s and stocks for ones that are lowly favored. Then, hopefully, the lowly favored shares will become favored once again and an investor will walk away with a profit. It can be daunting and terrifying to purchase stocks that most people are selling, but many people have become wealthy from doing just that. The buy low sell high approach is a large part of what made Warren Buffett so successful. Purchasing stocks that have become quite unpopular comes with some degree of risk. Yet, if you succeed, unpopular stocks can eventually yield high returns.

Related Articles
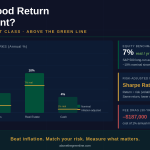
What Is a Good Return on Investment? Benchmarks by Asset Class

Growth ETFs: The Best Funds for Capital Appreciation — and the Concentration Risk Inside Each One
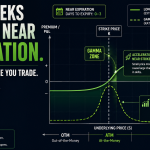
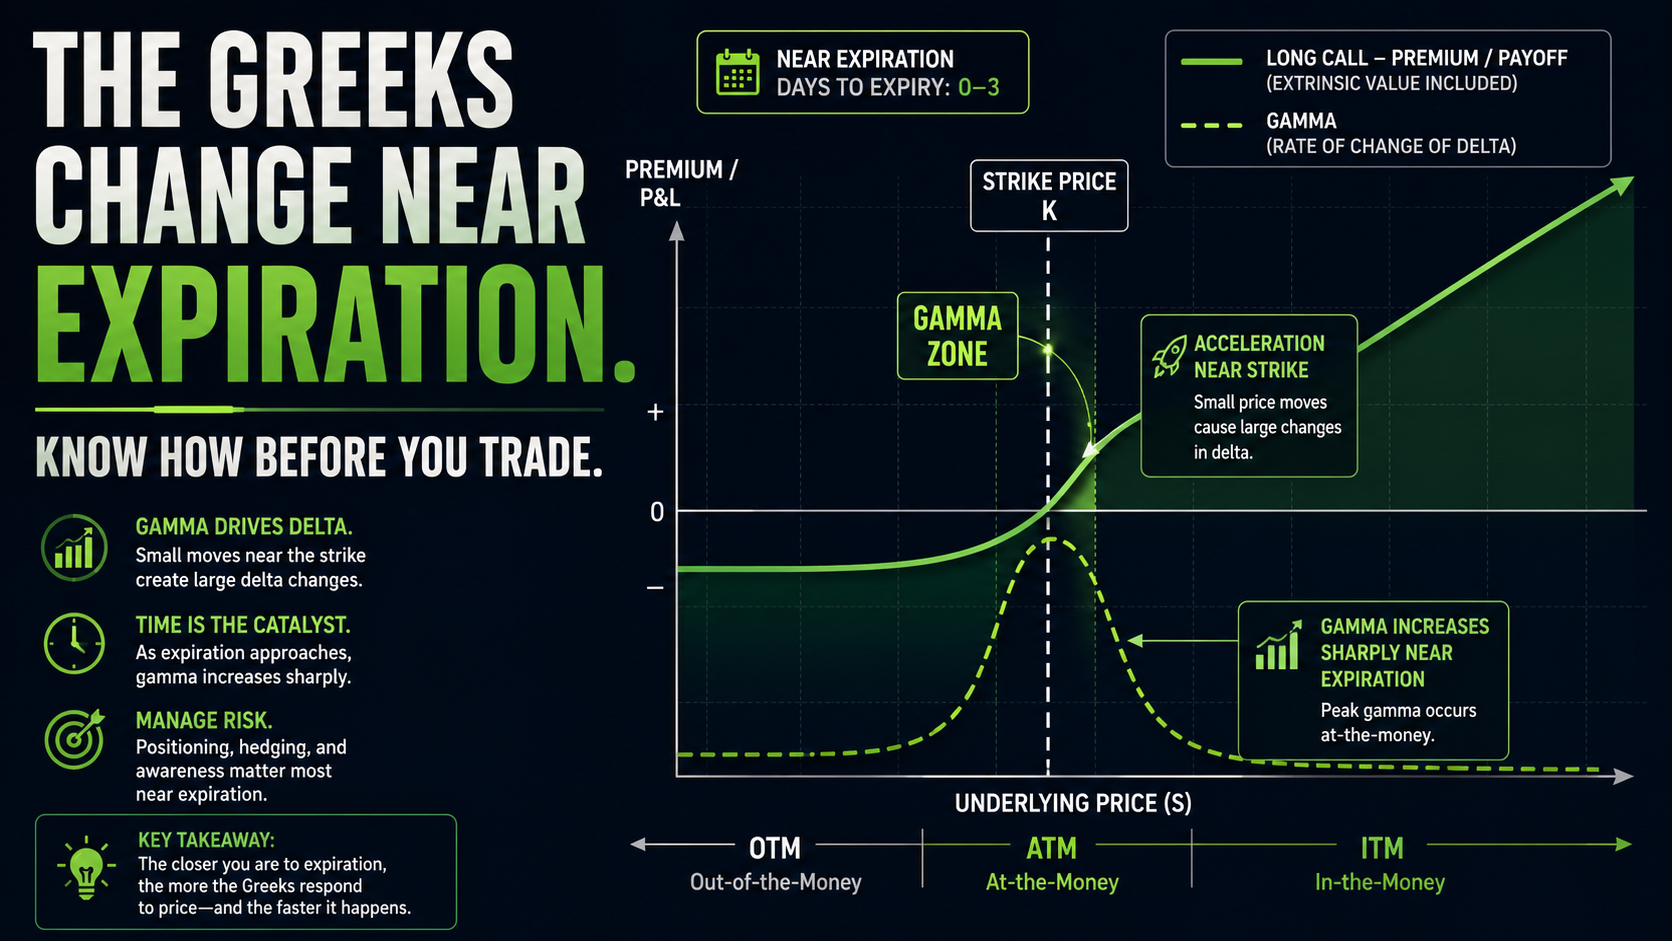
Day Trading Options: The Complete Guide to Intraday Strategies, Greeks, and Risk Management

Dividend ETFs: The Best Funds for Income Investors — SCHD, VIG, VYM, and How to Choose
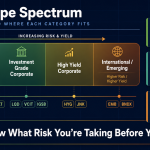
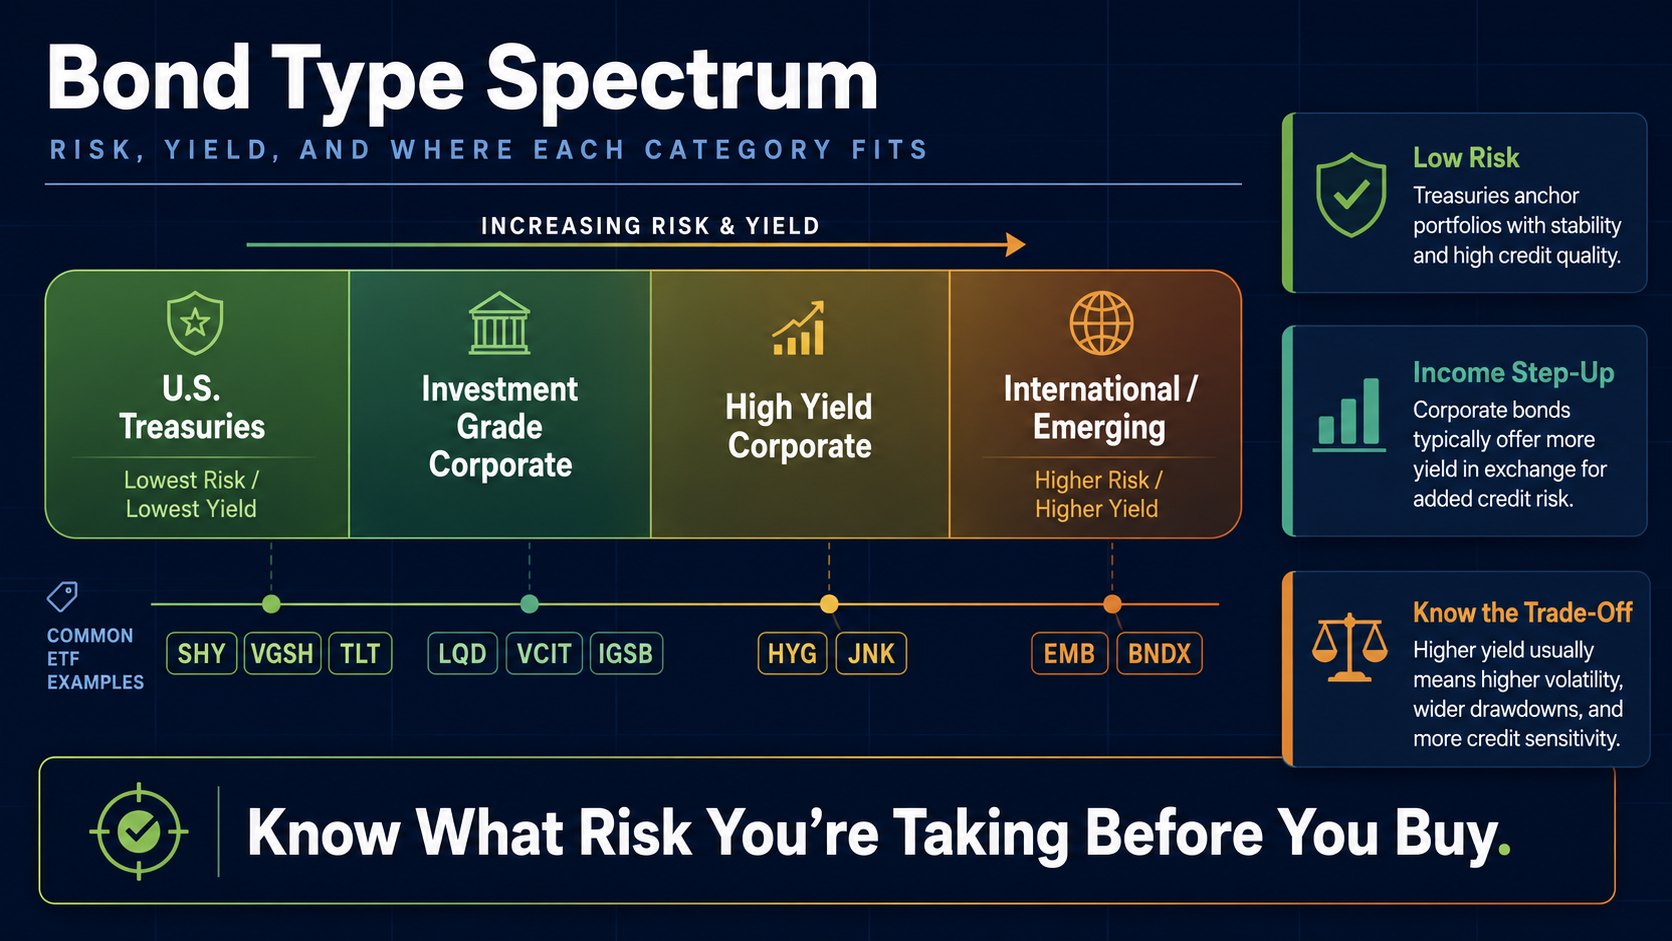
Investing in Bonds: The Complete How-To Guide Covering Every Bond Type, Purchase Method, and Portfolio Role