Above the Green Line -01
  • Market Insights
        • Commentary
          • Daily
          • Weekly
        • BUY / SELL SIGNALS
          • Trade Posts
          • Recent Trade Alerts
          • Recent Day Trades
        • BLOGROLL
          • Dividend Growth Blog
          • ETF Sector Blog
          • Dow Dogs
          • TPOW Blog
  • Strategies
        • SWING TRADING
          • Current Positions
          • Watchlists
          • Closed Positions
          • Candidates - TOP 100
          • Specialty Stocks
        • WEEKLY STOCK PICK
          • TPOW Charts
          • TPOW Performance
          • TPOW Strategy Guide
          • TPOW Performance Dashboard
        • DAY TRADING
          • Watch List
        • ATGL DASHBOARD
        • ETF STRATEGIES
          • ETF Sector Rotation
          • ETF Sector Portfolio
        • DIVIDEND GROWTH
          • Dividend Growth Portfolio
          • Dividend Calendar
        • DOGS OF THE DOW
          • Dogs of the Dow Portfolio
          • DOW 5 Portfolio
  • Markets
        • US MARKET
          • Commodities
          • Energy
          • Precious Metals
          • Volatility
        • GLOBAL MARKETS
          • Market Indices
          • Economic Calendar
          • FOREX Heat Map
          • FOREX Cross Rates
          • Crypto Currency Market
  • Investing
    • Discord Community
    • Dashboard
  • Resources
        • ARTICLES
          • Dividend Growth Model Articles
          • ETF Articles
          • Investment Strategies Articles
          • Market and Economic Insights
          • Stock Trade Articles
          • Stock Reviews
        • TOOLS
          • Stock Scanners
          • Charting Software
          • Brokerage Firms
        • STOCK CHARTS
          • Key Components
          • Reading Charts
          • Drawing Stock Charts
          • Identifying Trends
        • RETIREMENT PLANNING
  • About
    • Contact Us
    • How to Win
    • #1 At Stockcharts
    • Disclaimer
    • FAQ
  • Log In
  • Subscribe

March 9, 2020

Money Wave Alert! Mar 9, 2020

SPX W CHART
Buy on FEAR, Sell on GREED. FEAR is very high now.

Markets were down again today as Oil Prices collapsed. and more FEAR Selling. Investments that are still above their Green Lines should bounce well when the FEAR SELLING is over.

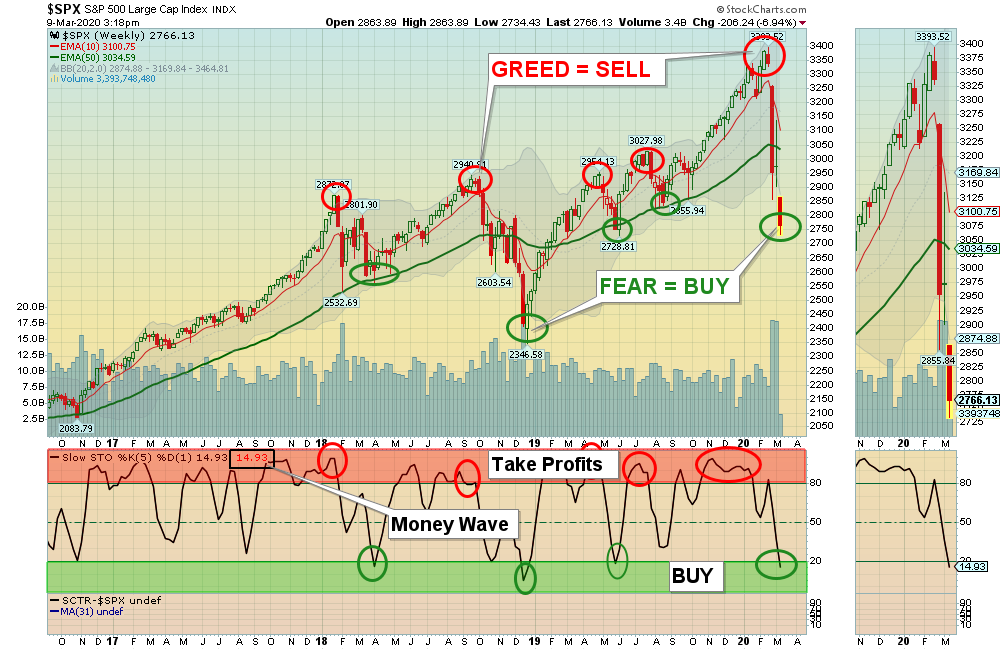
We are Lowering the Sell Stop Losses and NOT SELLING anything today on this panic. If you are uncomfortable with that, maybe Sell investments that are Below the Green Lines. This FEAR is very similar to the December 2018 Low (see chart above), and then the Markets had a big bounce… The next bounce might not be that strong, but will normally run up to the Red Lines (50-day averages).

So far the Strongest Leaders are holding up on this pull-back (Bullish). The higher Volume Leaders are: AAPL ABBV BMY MSFT NLOK PLUG SHOP & TSLA) should be good to Buy if the Markets bounce soon.

Bonds  were way up again today on Panic Buying, and are very over-bought.over

Crude Oil was down $10.10 today at $31.15.

______________________________________________________________________________________________________

The Following Investments will probably have a Money Wave Buy Signal soon. (Slow Stochastic Closing > 20) on today’s Close.

BUYS TODAY    3/9/2020    NONE TODAY


Money Wave Buys Signals Soon (Short Term):   (Best to Buy these when the S&P 500 is also in the Green Zone.)    


“JUMP START” Candidates:  (Buy Signal should be very soon… Click on the Jump Start link for more info.)  

NONE TODAY

______________________________________________________________________________________________________________________________________________

APT     ALPHA PRO TECH     

RNG     RING CENTRAL INC.     

UIS     UNISYS CORP.

Z     ZILLOW GROUP      Buy if it Closes above the Pink Line of $54.64 on High Volume.

Please be patient and wait for Money Wave Buy Signals.  We will email you when they are ready. Click on Watch List.

Emotions are very high now, so please do not Buy unless you are VERY NIMBLE.

The Leaders are Way Above the Green Lines (all Investments eventually return to their Green Lines).

___________________________________________________________________________________________________

SELLS TODAY     


ICLN     GLOBAL CLEAN ENERGY FUND    LOWER the Sell Stop Loss to below the Green Line of $11.07 on the Close.

QQQ     NASDAQ 100    LOWER the Sell Stop Loss to today’s Low of $192.11 on the Close. 

SMH     SEMICONDUCTOR FUND    LOWER the Sell Stop Loss to today’s Low of $120.66 on the Close. 

TMUS     T-MOBILE US    LOWER the Sell Stop Loss to below the Green Line of $78.81 on the Close.

XLK     TECH FUND       LOWER the Sell Stop Loss to today’s Low of $81.50 on the Close. 


CYH     COMMUNITY HEALTH       LOWER the Sell Stop Loss to below the Green Line of $3.69 on the Close.  This trade was not logged.     

NLOK     NORTON LIFELOCK      LOWER the Sell Stop Loss to below the Green Line of $14.70 on the Close.  This trade was not logged.   


Check   PORTFOLIO  (Open Positions) and adjust your Sell Stops. 

Click for  CLOSED POSITIONS, 

NEW! TOP 100 LIST Updated Mar 9, 2020

Many like to Buy the day before, near the Close, if the Money Wave is going to create a Buy Signal (Closing > 20 and out of the Green Zone).

Don’t Buy if the Investment has already popped up too much. Money Wave Buys are usually good for a 3-6 %  move in a few days.

We will “Not Log” trades if the Reward/Risk is not at least 2:1.

Related Post

– Money Wave Alert! Mar 6, 2020

Subscribe to Our Newsletter

AGL Logo

Get our eBook Now!

Candlestick - A Swing Traders Friend

We don’t spam! Read our privacy policy for more info.

You’ve been successfully subscribed to our newsletter!

Voted #1 at Stock Charts

SH Chart
Inverse S&P 500 Fund (SH) will have a Money Wave Buy today.

Help Us Help Animals

Help Us Help Animals

Recent Comments

  • Market Breadth Indicators: A Trader’s Guide to Early Trend Detection on Backtesting: Definition and How a Trading Strategy Backtest Works
  • Island Reversal Pattern: Definition and Formation Explained on Double Top Pattern: How to Identify and Trade This Reversal Signal
  • Channel Pattern Guide: What It Is and Why It Matters on A Guide to Forecasting Using Moving Averages
  • What Is a Broadening Bottom Chart Pattern? Full Guide on Bull vs. Bear Market: An Investor’s Guide to Market Phases
  • ATGL Weekly Money Flow - 2025-05-11 on ATGL Top Pick of the Week! Apr 6, 2025

Become a Green Liner!

Help me make more Money in the Stock Market.

ON ATGL

  • DashBoard
  • Weekly Commentary
  • Daily Buy / Sell Signals
  • Day Trade Setup
  • Trading Rooms

Design & Develop By Pixelvect

STRATEGIES

  • Swing Trading
  • ATGL Pick of the Week
  • Dividend Growth
  • ETF Sector Rotation
  • Dogs of the Dow

HELP

  • ATGL Trading Rules
  • FAQ
  • Account Maintenance
  • Contact US
  • Join

FOLLOW US

Instagram Linkedin Twitter Facebook

© COPYRIGHT 2024 · ABOVETHEGREENLINE.COM · ALL RIGHTS RESERVED · PRIVACY · TERMS · CONTACT · WATCHLIST · CURRENT