Above the Green Line -01
  • Market Insights
        • Commentary
          • Daily
          • Weekly
        • BUY / SELL SIGNALS
          • Trade Posts
          • Recent Trade Alerts
          • Recent Day Trades
        • BLOGROLL
          • Dividend Growth Blog
          • ETF Sector Blog
          • Dow Dogs
          • TPOW Blog
  • Strategies
        • SWING TRADING
          • Current Positions
          • Watchlists
          • Closed Positions
          • Candidates - TOP 100
          • Specialty Stocks
        • WEEKLY STOCK PICK
          • TPOW Charts
          • TPOW Performance
          • TPOW Strategy Guide
          • TPOW Performance Dashboard
        • DAY TRADING
          • Watch List
        • ATGL DASHBOARD
        • ETF STRATEGIES
          • ETF Sector Rotation
          • ETF Sector Portfolio
        • DIVIDEND GROWTH
          • Dividend Growth Portfolio
          • Dividend Calendar
        • DOGS OF THE DOW
          • Dogs of the Dow Portfolio
          • DOW 5 Portfolio
  • Markets
        • US MARKET
          • Commodities
          • Energy
          • Precious Metals
          • Volatility
        • GLOBAL MARKETS
          • Market Indices
          • Economic Calendar
          • FOREX Heat Map
          • FOREX Cross Rates
          • Crypto Currency Market
  • Investing
    • Discord Community
    • Dashboard
  • Resources
        • ARTICLES
          • Dividend Growth Model Articles
          • ETF Articles
          • Investment Strategies Articles
          • Market and Economic Insights
          • Stock Trade Articles
          • Stock Reviews
        • TOOLS
          • Stock Scanners
          • Charting Software
          • Brokerage Firms
        • STOCK CHARTS
          • Key Components
          • Reading Charts
          • Drawing Stock Charts
          • Identifying Trends
        • RETIREMENT PLANNING
  • About
    • Contact Us
    • How to Win
    • #1 At Stockcharts
    • Disclaimer
    • FAQ
  • Log In
  • Subscribe

February 8, 2020

Deutsche Bank AG – Long Term Buy soon

DEUTSCHE BANK AG (DB)


Company Profile

Belonging to the Financial industry, Deutsche Bank AG. engages in the provision of corporate banking and investment services. The company was founded by Adelbert Delbrueck on March 10, 1870 and is headquartered in Frankfurt am Main, Germany.

DB Chart
Wait for DB to return to the Green Zone.

What Happened?

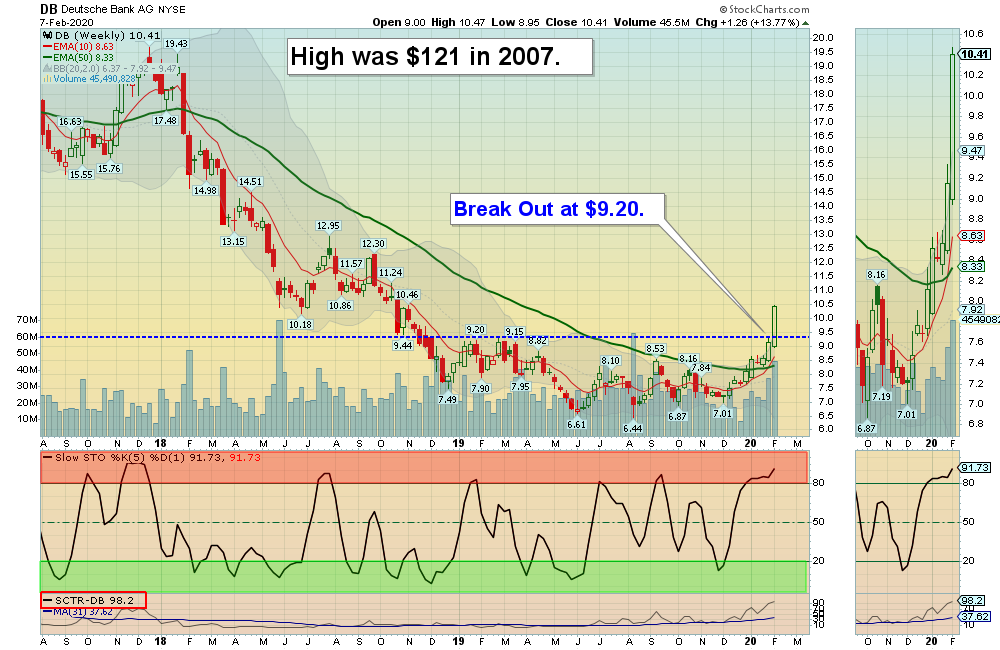
In the aftermath of the 2008 crash, Deutsche Bank’s success began to unravel. It had been one of the largest purveyors of junk bonds, selling about $32bn worth of collateralized debt between 2004 and 2008, but its traders were also betting against that market in order to line their own pockets. Greg Lippmann, Deutsche’s former head of asset-backed securities trading, even referred to some bonds as “crap” and “pigs” in emails to colleagues, all the while promoting them to investors as A-grade. The stock price dropped from a High of $121 to $4.44 (less than 1/2 of Book Value).

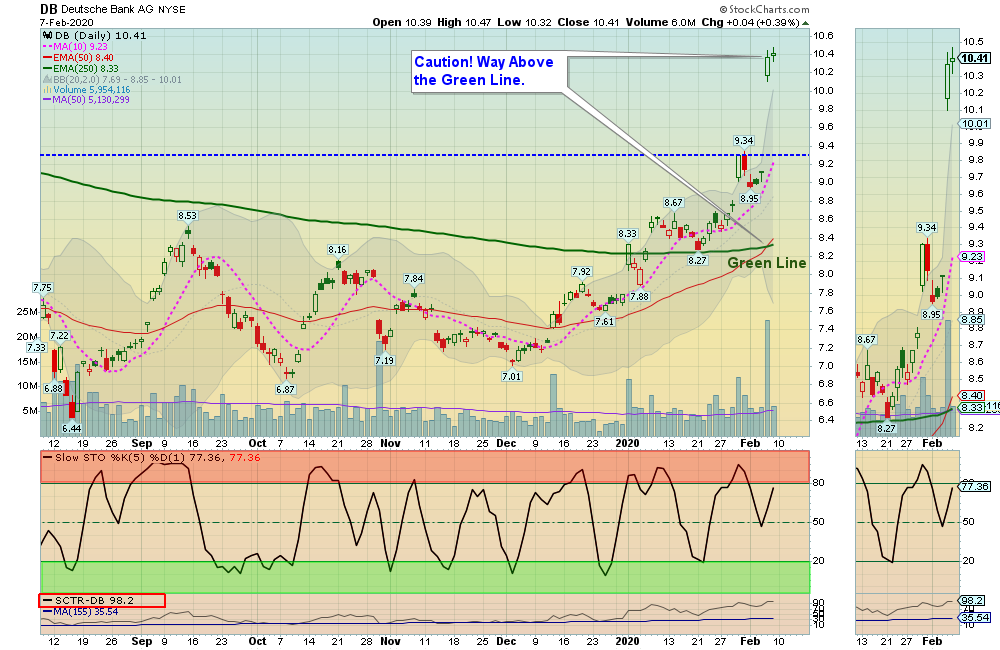
However, recently shares of DB have made new 52-week Highs on Thursday Feb. 6, 2020 after snagging a major new investment from fund giant Capital Group. The Los Angeles-based fund manager revealed a 3.1% stake in the bank in Frankfurt on Thursday,

This has caused a technical Break Out on the stock above $9.34. which now should become Support. This could also mean that many Investors agree that the Company will no longer go broke. It could also be acquired way below the All Time High of $121.   As a result, its Relative Strength as evidence in the daily chart is now 98.

When to Buy?

DB is currently Way Above the Green Line. We will wait to Buy when DB returns to the Green Zone for a Daily Money Wave Buy Signal.

Objective

Above the Green Line is watching DB for a long term investment.

DB W Chart
Long Term Chart on Deutsche Bank (DB)

Follow the Rules: Above the Green Line + Above 90 Relative Strength

Join Now
Become a Green Liner!

Daily Investment Commentary

Subscribe to Our Newsletter

AGL Logo

Get our eBook Now!

Candlestick - A Swing Traders Friend

We don’t spam! Read our privacy policy for more info.

You’ve been successfully subscribed to our newsletter!

Voted #1 at Stock Charts

SH Chart
Inverse S&P 500 Fund (SH) will have a Money Wave Buy today.

Help Us Help Animals

Help Us Help Animals

Recent Comments

  • Market Breadth Indicators: A Trader’s Guide to Early Trend Detection on Backtesting: Definition and How a Trading Strategy Backtest Works
  • Island Reversal Pattern: Definition and Formation Explained on Double Top Pattern: How to Identify and Trade This Reversal Signal
  • Channel Pattern Guide: What It Is and Why It Matters on A Guide to Forecasting Using Moving Averages
  • What Is a Broadening Bottom Chart Pattern? Full Guide on Bull vs. Bear Market: An Investor’s Guide to Market Phases
  • ATGL Weekly Money Flow - 2025-05-11 on ATGL Top Pick of the Week! Apr 6, 2025

Become a Green Liner!

Help me make more Money in the Stock Market.

ON ATGL

  • DashBoard
  • Weekly Commentary
  • Daily Buy / Sell Signals
  • Day Trade Setup
  • Trading Rooms

Design & Develop By Pixelvect

STRATEGIES

  • Swing Trading
  • ATGL Pick of the Week
  • Dividend Growth
  • ETF Sector Rotation
  • Dogs of the Dow

HELP

  • ATGL Trading Rules
  • FAQ
  • Account Maintenance
  • Contact US
  • Join

FOLLOW US

Instagram Linkedin Twitter Facebook

© COPYRIGHT 2024 · ABOVETHEGREENLINE.COM · ALL RIGHTS RESERVED · PRIVACY · TERMS · CONTACT · WATCHLIST · CURRENT