Above the Green Line -01
  • Market Insights
        • Commentary
          • Daily
          • Weekly
        • BUY / SELL SIGNALS
          • Trade Posts
          • Recent Trade Alerts
          • Recent Day Trades
        • BLOGROLL
          • Dividend Growth Blog
          • ETF Sector Blog
          • Dow Dogs
          • TPOW Blog
  • Strategies
        • SWING TRADING
          • Current Positions
          • Watchlists
          • Closed Positions
          • Candidates - TOP 100
          • Specialty Stocks
        • WEEKLY STOCK PICK
          • TPOW Charts
          • TPOW Performance
          • TPOW Strategy Guide
          • TPOW Performance Dashboard
        • DAY TRADING
          • Watch List
        • ATGL DASHBOARD
        • ETF STRATEGIES
          • ETF Sector Rotation
          • ETF Sector Portfolio
        • DIVIDEND GROWTH
          • Dividend Growth Portfolio
          • Dividend Calendar
        • DOGS OF THE DOW
          • Dogs of the Dow Portfolio
          • DOW 5 Portfolio
  • Markets
        • US MARKET
          • Commodities
          • Energy
          • Precious Metals
          • Volatility
        • GLOBAL MARKETS
          • Market Indices
          • Economic Calendar
          • FOREX Heat Map
          • FOREX Cross Rates
          • Crypto Currency Market
  • Investing
    • Discord Community
    • Dashboard
  • Resources
        • ARTICLES
          • Dividend Growth Model Articles
          • ETF Articles
          • Investment Strategies Articles
          • Market and Economic Insights
          • Stock Trade Articles
          • Stock Reviews
        • TOOLS
          • Stock Scanners
          • Charting Software
          • Brokerage Firms
        • STOCK CHARTS
          • Key Components
          • Reading Charts
          • Drawing Stock Charts
          • Identifying Trends
        • RETIREMENT PLANNING
  • About
    • Contact Us
    • How to Win
    • #1 At Stockcharts
    • Disclaimer
    • FAQ
  • Log In
  • Subscribe

ETF Sector Rotation Strategy

ETF Sector Rotation – What is it?

Many investors are interested in investing and diversifying their portfolio in various global and local sectors, but are often unsure of where to start. Sector rotation is a strategy used by investors whereby they hold an overweight position in strong sectors and underweight positions in weaker sectors. Exchange-traded funds (ETFs) that concentrate on specific industry sectors offer investors a straightforward way to participate in the rotation of an industry sector. ETFs also allow an investor to take advantage of the investment opportunities in many industry groups throughout the world. Sector Rotation Strategy can help you achieve your investment objective.

Members can access your Green Line ETF Sector Portfolio HERE.

Sector Chart
Rotate to the 5 Strongest ETFs every three months.


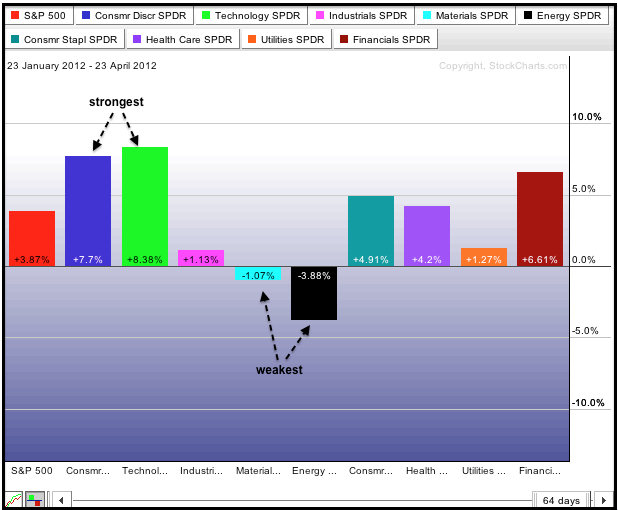
Why Do Investors Choose Sector Rotation?

As the economy moves forward, different sectors of the economy tend to perform better than others. Investors seeking to beat the market may spend countless hours reading through articles and research reports.

A simpler alternative is to use ETFs that focus on specific sectors. Sector rotation strategy takes advantage of economic cycles by investing in the sectors that are rising and avoiding the ones that are falling.  Another alternative is the 3% Sig strategy.

By investing in a diversified set of ETFs, an investor is positioned to take advantage of an uptrend in certain sectors while reducing the risk of losses due to exposure to high-risk stocks. In addition, by selling a portion of your holdings in sectors that are at the peak of their cycle and reinvesting in those sectors that are expected to perform well in the next few months, you are following a disciplined investment strategy.

The Green Line Strategy:

  • Own the 5 Strongest ETFs based on Volume and 1 year Relative Strength.
  • ETF must be Above the Green Line (250-day ema average), or move to Money Market (CASH).
  • Every three months rotate to the Strongest ETFs.
  • ETF Fund Rotation is Quarterly.

Below is a simulated back test of the ATGL ETF Rotation System (Equity in blue) compared to the S&P 500 Index for the last 20 years.

ETF chart
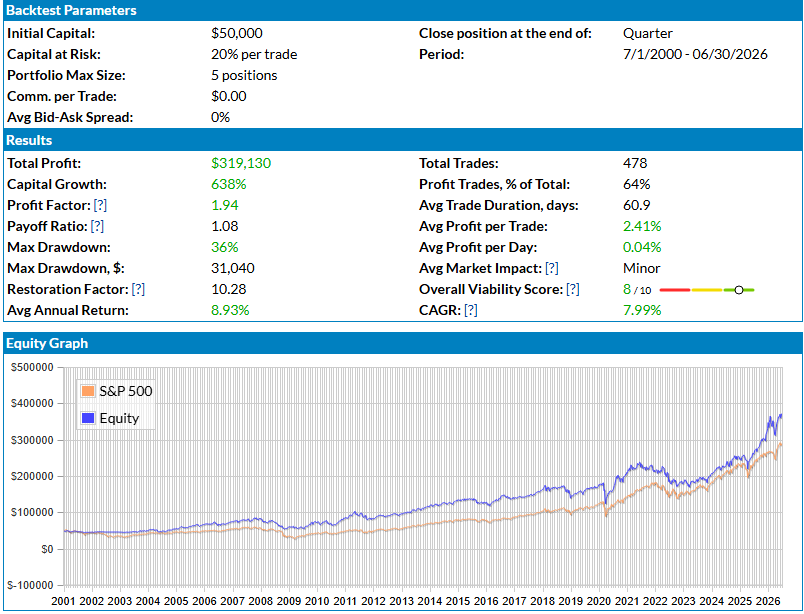
ETF Rotation System Back-Test (Not actual results).

Members can access your Green Line ETF Sector Portfolio HERE.


Please send some profits to help animals (ASPCA).

Subscribe to Our Newsletter

AGL Logo

Get our eBook Now!

Candlestick - A Swing Traders Friend

We don’t spam! Read our privacy policy for more info.

You’ve been successfully subscribed to our newsletter!

Voted #1 at Stock Charts

SH Chart
Inverse S&P 500 Fund (SH) will have a Money Wave Buy today.

Help Us Help Animals

Help Us Help Animals

Recent Comments

  • Market Breadth Indicators: A Trader’s Guide to Early Trend Detection on Backtesting: Definition and How a Trading Strategy Backtest Works
  • Island Reversal Pattern: Definition and Formation Explained on Double Top Pattern: How to Identify and Trade This Reversal Signal
  • Channel Pattern Guide: What It Is and Why It Matters on A Guide to Forecasting Using Moving Averages
  • What Is a Broadening Bottom Chart Pattern? Full Guide on Bull vs. Bear Market: An Investor’s Guide to Market Phases
  • ATGL Weekly Money Flow - 2025-05-11 on ATGL Top Pick of the Week! Apr 6, 2025

Become a Green Liner!

Help me make more Money in the Stock Market.

ON ATGL

  • DashBoard
  • Weekly Commentary
  • Daily Buy / Sell Signals
  • Day Trade Setup
  • Trading Rooms

Design & Develop By Pixelvect

STRATEGIES

  • Swing Trading
  • ATGL Pick of the Week
  • Dividend Growth
  • ETF Sector Rotation
  • Dogs of the Dow

HELP

  • ATGL Trading Rules
  • FAQ
  • Account Maintenance
  • Contact US
  • Join

FOLLOW US

Instagram Linkedin Twitter Facebook

© COPYRIGHT 2024 · ABOVETHEGREENLINE.COM · ALL RIGHTS RESERVED · PRIVACY · TERMS · CONTACT · WATCHLIST · CURRENT