Above the Green Line -01
  • Market Insights
        • Commentary
          • Daily
          • Weekly
        • BUY / SELL SIGNALS
          • Trade Posts
          • Recent Trade Alerts
          • Recent Day Trades
        • BLOGROLL
          • Dividend Growth Blog
          • ETF Sector Blog
          • Dow Dogs
          • TPOW Blog
  • Strategies
        • SWING TRADING
          • Current Positions
          • Watchlists
          • Closed Positions
          • Candidates - TOP 100
          • Specialty Stocks
        • WEEKLY STOCK PICK
          • TPOW Charts
          • TPOW Performance
          • TPOW Strategy Guide
          • TPOW Performance Dashboard
        • DAY TRADING
          • Watch List
        • ATGL DASHBOARD
        • ETF STRATEGIES
          • ETF Sector Rotation
          • ETF Sector Portfolio
        • DIVIDEND GROWTH
          • Dividend Growth Portfolio
          • Dividend Calendar
        • DOGS OF THE DOW
          • Dogs of the Dow Portfolio
          • DOW 5 Portfolio
  • Markets
        • US MARKET
          • Commodities
          • Energy
          • Precious Metals
          • Volatility
        • GLOBAL MARKETS
          • Market Indices
          • Economic Calendar
          • FOREX Heat Map
          • FOREX Cross Rates
          • Crypto Currency Market
  • Investing
    • Discord Community
    • Dashboard
  • Resources
        • ARTICLES
          • Dividend Growth Model Articles
          • ETF Articles
          • Investment Strategies Articles
          • Market and Economic Insights
          • Stock Trade Articles
          • Stock Reviews
        • TOOLS
          • Stock Scanners
          • Charting Software
          • Brokerage Firms
        • STOCK CHARTS
          • Key Components
          • Reading Charts
          • Drawing Stock Charts
          • Identifying Trends
        • RETIREMENT PLANNING
  • About
    • Contact Us
    • How to Win
    • #1 At Stockcharts
    • Disclaimer
    • FAQ
  • Log In
  • Subscribe

December 28, 2019

Rite Aid Corp. – Long Term Buy soon

RITE AID CORP. (RAD)


Company Profile

Belonging to the Drug Store industry, Rite Aid Corp. is a $977-million Drug Store chain in the US. The company ranked No. 94 in the 2018 Fortune 500 list of the largest United States corporations by total revenue.

RAD Chart
Wait for RAD to return back down to the Green Zone.

What Happened?

The story is pretty simple. E-commerce happened. When e-commerce happened, everything changed. Consumers shifted from physical to digital shopping. Some retailers changed with the times — in the pharmacy world, see Walgreens (NASDAQ:WBA) and CVS (NYSE:CVS) — and have since thrived as omni-channel retailers. Both Walgreens and CVS have seen their pharmacy market shares grow from 2010 to 2018.

Other retailers didn’t adapt. See Rite Aid, who didn’t refresh stores to be tech-savvy or build out a robust e-commerce business. Not surprisingly, Rite Aid’s pharmacy market share has dropped from 6.2% in 2010, to 2.6% in 2018, while it has gone from a top three pharmacy retailer in 2010, to being nudged out of the top five by the likes of Walmart (NYSE:WMT) and Kroger (NYSE:KR).

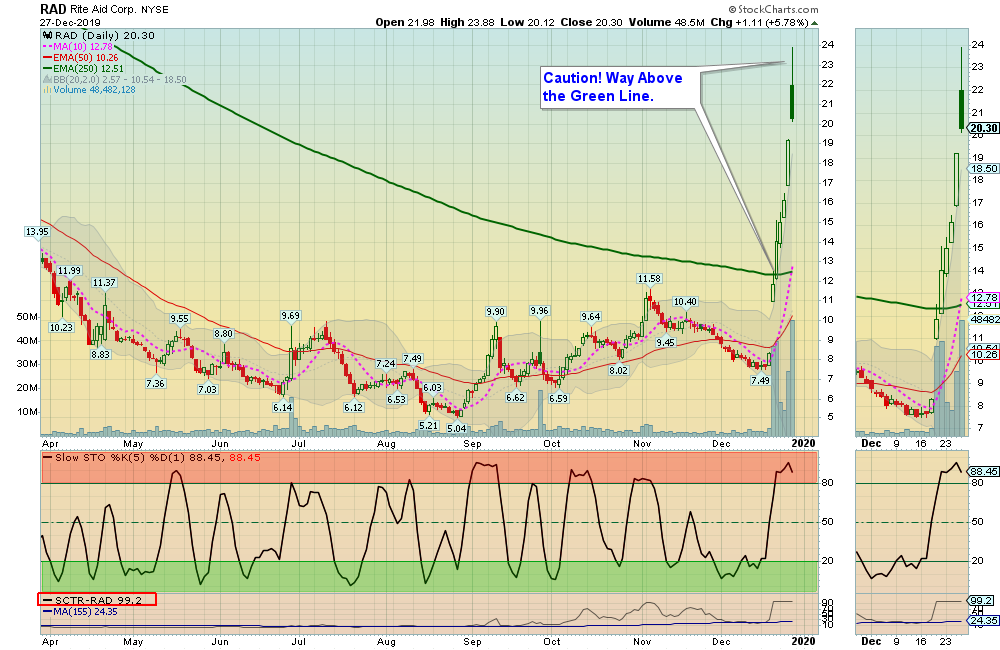
However, recently shares of Rite Aid (NYSE:RAD) were skyrocketing 45.7% higher on Thursday after the company announced its third-quarter results before the market opened. Rite Aid reported revenue of $5.46 billion, above the average analysts’ estimate of $5.42 billion. The pharmacy retailer posted adjusted earnings of $0.54 per share, blowing past the consensus Wall Street estimate of earnings of $0.09 per share. has been improving as a result of newly formed partnerships that expanded the customer base.  As a result, its Relative Strength as evidence in the daily chart is now 99.

When to Buy?

RAD is currently Way Above the Green Line. We will wait to Buy when RAD returns to the Green Zone for a Daily Money Wave Buy Signal.

Objective

Above the Green Line is watching RAD for a long term investment.

RAD-W Chart
Long Term Chart on Rite Aid Corp.

Follow the Rules: Above the Green Line + Above 90 Relative Strength

Join Now
Become a Green Liner!

Daily Investment Commentary

Subscribe to Our Newsletter

AGL Logo

Get our eBook Now!

Candlestick - A Swing Traders Friend

We don’t spam! Read our privacy policy for more info.

You’ve been successfully subscribed to our newsletter!

Voted #1 at Stock Charts

SH Chart
Inverse S&P 500 Fund (SH) will have a Money Wave Buy today.

Help Us Help Animals

Help Us Help Animals

Recent Comments

  • Market Breadth Indicators: A Trader’s Guide to Early Trend Detection on Backtesting: Definition and How a Trading Strategy Backtest Works
  • Island Reversal Pattern: Definition and Formation Explained on Double Top Pattern: How to Identify and Trade This Reversal Signal
  • Channel Pattern Guide: What It Is and Why It Matters on A Guide to Forecasting Using Moving Averages
  • What Is a Broadening Bottom Chart Pattern? Full Guide on Bull vs. Bear Market: An Investor’s Guide to Market Phases
  • ATGL Weekly Money Flow - 2025-05-11 on ATGL Top Pick of the Week! Apr 6, 2025

Become a Green Liner!

Help me make more Money in the Stock Market.

ON ATGL

  • DashBoard
  • Weekly Commentary
  • Daily Buy / Sell Signals
  • Day Trade Setup
  • Trading Rooms

Design & Develop By Pixelvect

STRATEGIES

  • Swing Trading
  • ATGL Pick of the Week
  • Dividend Growth
  • ETF Sector Rotation
  • Dogs of the Dow

HELP

  • ATGL Trading Rules
  • FAQ
  • Account Maintenance
  • Contact US
  • Join

FOLLOW US

Instagram Linkedin Twitter Facebook

© COPYRIGHT 2024 · ABOVETHEGREENLINE.COM · ALL RIGHTS RESERVED · PRIVACY · TERMS · CONTACT · WATCHLIST · CURRENT