Above the Green Line -01
  • Market Insights
        • Commentary
          • Daily
          • Weekly
        • BUY / SELL SIGNALS
          • Trade Posts
          • Recent Trade Alerts
          • Recent Day Trades
        • BLOGROLL
          • Dividend Growth Blog
          • ETF Sector Blog
          • Dow Dogs
          • TPOW Blog
  • Strategies
        • SWING TRADING
          • Current Positions
          • Watchlists
          • Closed Positions
          • Candidates - TOP 100
          • Specialty Stocks
        • WEEKLY STOCK PICK
          • TPOW Charts
          • TPOW Performance
          • TPOW Strategy Guide
          • TPOW Performance Dashboard
        • DAY TRADING
          • Watch List
        • ATGL DASHBOARD
        • ETF STRATEGIES
          • ETF Sector Rotation
          • ETF Sector Portfolio
        • DIVIDEND GROWTH
          • Dividend Growth Portfolio
          • Dividend Calendar
        • DOGS OF THE DOW
          • Dogs of the Dow Portfolio
          • DOW 5 Portfolio
  • Markets
        • US MARKET
          • Commodities
          • Energy
          • Precious Metals
          • Volatility
        • GLOBAL MARKETS
          • Market Indices
          • Economic Calendar
          • FOREX Heat Map
          • FOREX Cross Rates
          • Crypto Currency Market
  • Investing
    • Discord Community
    • Dashboard
  • Resources
        • ARTICLES
          • Dividend Growth Model Articles
          • ETF Articles
          • Investment Strategies Articles
          • Market and Economic Insights
          • Stock Trade Articles
          • Stock Reviews
        • TOOLS
          • Stock Scanners
          • Charting Software
          • Brokerage Firms
        • STOCK CHARTS
          • Key Components
          • Reading Charts
          • Drawing Stock Charts
          • Identifying Trends
        • RETIREMENT PLANNING
  • About
    • Contact Us
    • How to Win
    • #1 At Stockcharts
    • Disclaimer
    • FAQ
  • Log In
  • Subscribe

December 26, 2019

Multiple Time Frame Strategy

Multiple Time Frame Strategy

By Author

Updated October 2, 2024

Table of Contents

Toggle
  • Multiple Time Frame Strategy
      • What is Multiple Time Frame Analysis?
      • How to Use
      • The Significance of the Time Frame Scale
      • Key Takeaways

What is Multiple Time Frame Analysis?

The multiple time frame investment strategy can best be defined as an approach that examines securities at different intervals of time. A security is any financial instrument that holds monetary value. It can be a stock, bond, currency pair, etc. When using multiple time frame analysis, an investor will typically examine three or more different periods of time; any less than this can result in a considerable loss of data. Generally, analysts believe that the more intervals surveyed, the more reliable the data. However, when it comes to exactly what intervals should be surveyed, it varies.

How to Use

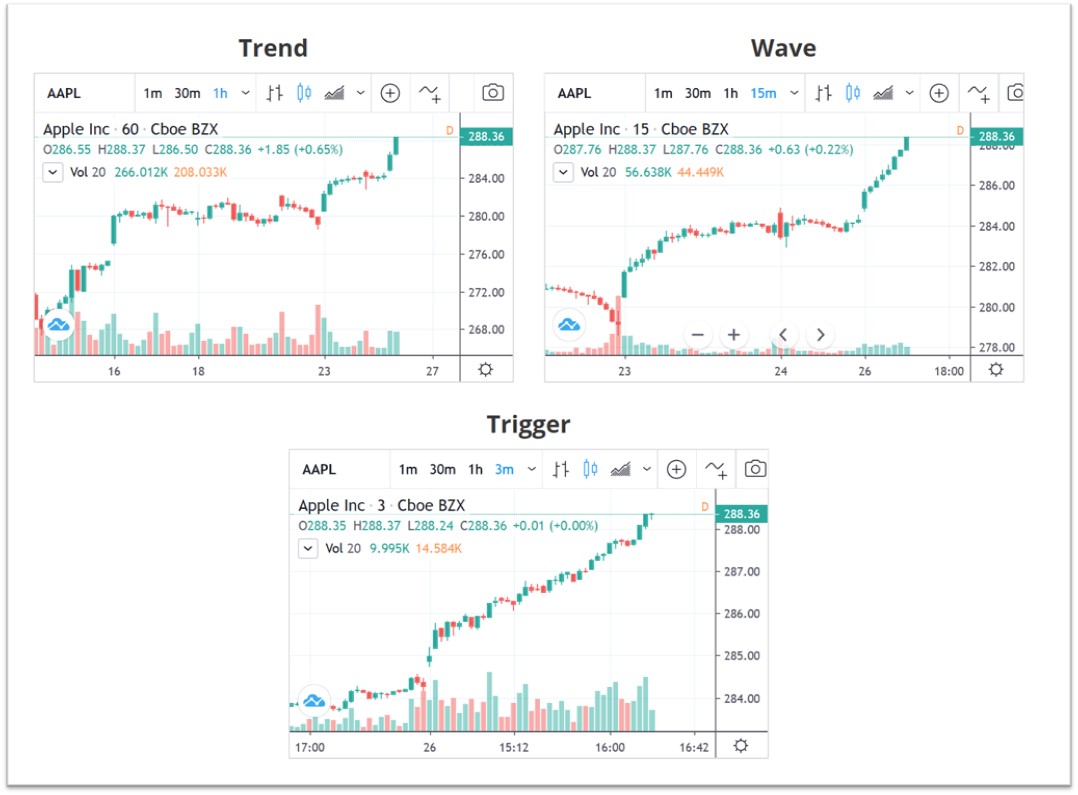
How one employs multiple time frame analysis depends entirely on the investor’s strategy. For instance, a long term trader might examine data over weeks to months while a swing trader may focus on weekly or daily charts to identify short term trends. A day trader may identify short term trends using minute charts that can range from 15 to 240-minutes. There are many ways an investor can utilize this approach. Commonly, once an investor decides upon their desired holding period they will settle into their choice and seldom think to change it. While stability can be beneficial, being unable to consider a change in methodology can cause one to overlook the bigger picture. On the other hand, switching from time frame to time frame impulsively is often unwise. It is important to find a middle ground between these two extremes and consider data from a multitude of time frames.

Multiple time frame analysis over time
http://tradetight.org/forums/thread-view.asp?tid=1017&posts=2&start=1

The Significance of the Time Frame Scale

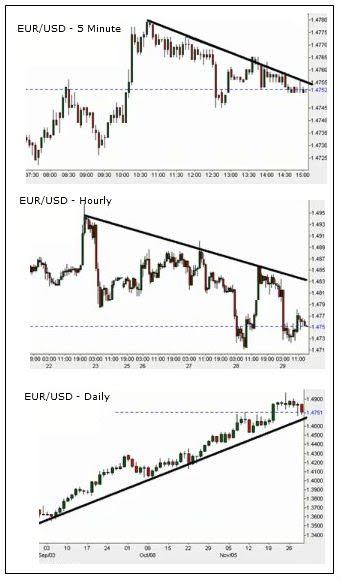
As seen in the image below, security can be examined over a long and/or short period of time. Here, we will discuss the meaning and importance of the examination of a range of time frames from long to short-term. Examining a long-term time frame will provide the dominant trend. It is commonly advised to trade in the direction of the dominant trend for results with a larger expectation of profit. Nevertheless, one could still trade against the dominant trend. The fundamentals of fundamental analysis, as discussed in a prior article, have a large impact on the direction of the trend and should be frequently observed. Additionally, interest rates are another component to monitor when utilizing a long-term time frame as they are crucial to determining financial instruments such as the exchange rate.

Out of the three, the medium-term time frame is the most flexible due to the fact that it has components of both long-term and short-term frequencies. When observing this time frame, one is able to zoom in on the broader, dominant trend and thus smaller components come to light. Applying the medium-term time frame is particularly significant as one should plan their trade at this stage.

Lastly, the short-term time frame is the point of action. While examining this time frame, price fluctuations become increasingly more clear. Due to this, a trader is able to better choose a point of entry. It is important to note that fundamental components and economic indicators do play a role in this time frame, but one that is very short-term. The narrowness of this particular examination causes the role of fundamentals to appear grand and volatile, but normally the changes they create do not stick around for too long. However, it is still imperative one observes them as a trader should avoid making decisions during a temporary imbalance.

From long to short-term, each time frame has its benefits that are crucial when it comes to participating in a trade. When all three of the time frames are considered and employed correctly in the evaluation of securities, the probability of success for a trader improves significantly.

Key Takeaways

Overall, applying multiple time-frame analysis can greatly improve the outcome of a trade. Settling into a specified comfort zone is more than likely of no benefit to a trader. Multiple time frame analysis provides a comprehensive view of security trade that will result in a larger profit target for a trader.

Apple Inc. Multiple Time Frame Analysis

Related Articles

Market Breadth Indicators

Market Breadth Indicators: Spot Trend Momentum Before It’s Obvious

Stock prices tell only part of the market’s story. While index movements capture headlines, the underlying participation and strength of ...
Read More
V Chart Patterns

How to Trade the V Pattern Chart Using Volume and Momentum

Sharp reversals catch traders unprepared. These aggressive recoveries, driven by heavy volume and strong momentum, often signal institutional involvement. The ...
Read More
Channel Patterns

Trading Channel Patterns: Full Guide to Ascending & Descending Breakouts

Technical analysis provides traders with powerful tools to identify potential market movements before they occur. Channel patterns provide some of ...
Read More
Spike Chart Patterns

Spike Chart Pattern Strategy: Reacting Fast to Price Surges

Sudden price increases create unique patterns on trading charts that investors need to notice quickly. These quick movements, known as ...
Read More
Broadening Bottom Pattern

Broadening Bottom Pattern Guide: Data-Driven Signals for Buy Setups

Chart patterns are the foundation of technical analysis, providing traders with visual frameworks to anticipate market movements and capitalize on ...
Read More
Broadening Top Pattern

Broadening Top Chart Pattern Decoded: Spot High-Volatility Setups Early

The broadening top chart pattern is one of the most distinctive reversal formations in technical analysis. This pattern emerges when ...
Read More

ON ATGL

  • DashBoard
  • Weekly Commentary
  • Daily Buy / Sell Signals
  • Day Trade Setup
  • Trading Rooms

Design & Develop By Pixelvect

STRATEGIES

  • Swing Trading
  • ATGL Pick of the Week
  • Dividend Growth
  • ETF Sector Rotation
  • Dogs of the Dow

HELP

  • ATGL Trading Rules
  • FAQ
  • Account Maintenance
  • Contact US
  • Join

FOLLOW US

Instagram Linkedin Twitter Facebook

© COPYRIGHT 2024 · ABOVETHEGREENLINE.COM · ALL RIGHTS RESERVED · PRIVACY · TERMS · CONTACT · WATCHLIST · CURRENT