
By ATGL
Updated October 23, 2025
Open interest is one of the most overlooked metrics in options trading, yet it can reveal critical insights into market activity and sentiment. While traders often focus exclusively on price action and volume, open interest provides a distinct perspective on the strength and sustainability of market moves.
Understanding the open interest ratio becomes particularly valuable when evaluating whether current market positioning supports or contradicts price trends. This article breaks down what open interest means, how it differs from volume, and how traders can use it to strengthen their trading decisions and timing.
What Does Open Interest Mean in Options Trading?
Open interest in stock options trading represents the total number of active option contracts that remain open and have not been closed, exercised, or expired. Each option contract has a buyer and a seller, so when calculating open interest, the exchange counts only one side of the transaction.
The calculation updates at the end of each trading day. When a trader opens a new position, open interest increases by one. When both parties close their existing positions through an offsetting trade, open interest decreases by one.
High open interest generally indicates strong market confidence and substantial liquidity at particular strike prices. Strike prices with thousands of contracts in open interest typically offer tighter bid-ask spreads and easier execution compared to strikes with minimal activity.
Open Interest vs Volume: Why Both Metrics Matter
Volume and open interest in options serve different analytical purposes. Volume measures how many contracts changed hands during a specific trading session, regardless of whether those transactions opened new positions or closed existing ones. Open interest tracks the cumulative number of contracts that remain active across all sessions.
Consider this example of open interest in options: if 200 call option contracts trade during Monday’s session, the volume equals 200 contracts. However, if 120 of those trades represented new positions opening while 80 closed existing positions, open interest would increase by only 40 contracts. The next day, if 150 contracts trade with 60 opening new positions and 90 closing positions, volume registers 150, but open interest drops by 30 contracts.
High volume with declining open interest suggests traders are exiting positions rather than establishing new ones. Conversely, rising open interest alongside increasing volume confirms that new capital is entering the market.
How Do Changes in Open Interest Signal Market Sentiment?
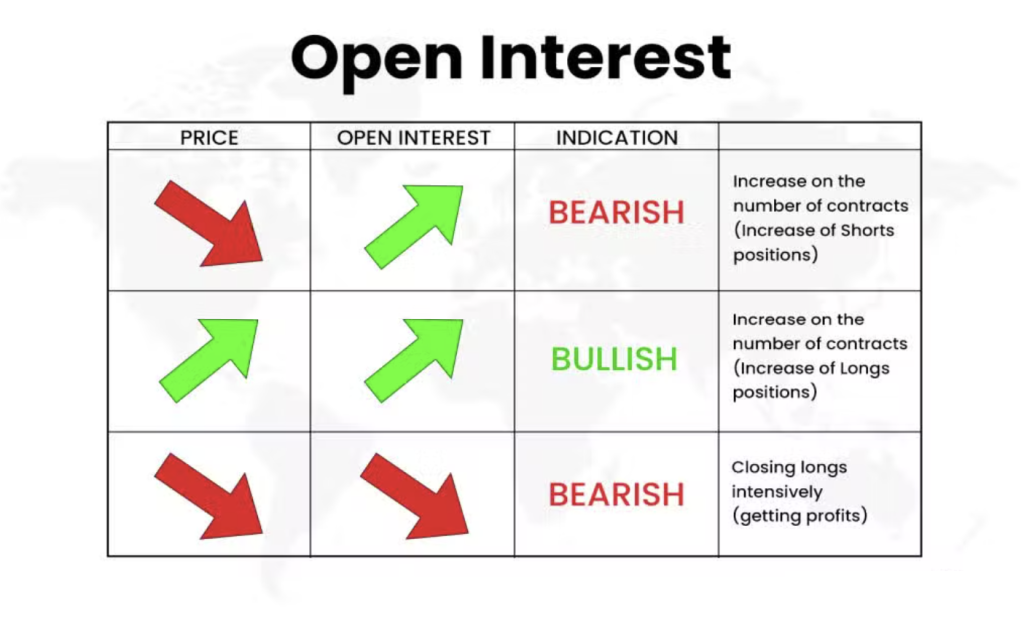
Shifts in open interest provide valuable clues about trader expectations. When open interest in call options rises while prices advance, this pattern typically signals bullish sentiment—traders are establishing new long positions in anticipation of further gains.
Rising open interest in put options during a price decline often reflects bearish expectations. However, if put open interest rises while prices climb, it might indicate hedging activity rather than outright bearish bets.
Rising open interest during a price advance with strong volume confirms bullish momentum. Declining open interest during a rally may suggest profit-taking and weakening conviction. Monitoring these patterns across bull and bear markets helps traders identify which signals carry the most weight in different environments.
Sudden spikes in open interest at specific strike prices can flag where major traders have positioned themselves, potentially creating magnets for price action. These concentrations sometimes contribute to phenomena like the gamma squeeze technique.
Why Is Open Interest a Key Indicator for Options Traders?
Monitoring open interest delivers practical advantages. Options with robust open interest typically offer narrower bid-ask spreads and better fill prices. A call option with 10,000 contracts in open interest will generally provide smoother entry and exit compared to one with only 50 contracts.
Strike prices with exceptionally high open interest often act as magnetic price levels. These concentrations can create temporary support or resistance zones as market makers hedge their exposure.
Rising open interest during a price trend adds credibility to the move. If a stock rallies while call open interest climbs significantly, the data suggests new participants are backing the advance. Declining open interest during a price move may indicate existing position holders closing trades rather than new money driving the trend.
The interest rate impact on option pricing must also be considered alongside open interest analysis, as changing rates can shift where traders concentrate their positioning.
Examples of How Traders Interpret Open Interest
Examining real-world scenarios demonstrates how open interest analysis translates into trading decisions. Consider a stock trading at $75 with the following open interest distribution for options expiring in 30 days:
- $70 strike: 8,500 contracts (mostly puts)
- $75 strike: 12,000 contracts (balanced calls and puts)
- $80 strike: 15,000 contracts (mostly calls)
The heavy call open interest at the $80 strike suggests many traders anticipate the stock reaching that level before expiration. If the stock begins climbing toward $80 and open interest at that strike increases further while volume surges, the combination confirms bullish momentum.
Alternatively, if the stock approaches $80 but open interest at that strike begins declining sharply, it signals position holders are taking profits. This divergence often precedes reversals, as the concentration of activity that might have pulled prices higher dissipates.
What Does It Mean When Open Interest Is Zero?
Zero open interest at a particular strike price indicates no active contracts remain open at that level. No traders currently hold positions for that specific combination of strike price, expiration date, and option type.
This absence signals that liquidity risk is a major concern. Attempting to trade an option with zero open interest means no natural counterparty exists, typically resulting in extremely wide bid-ask spreads and difficulty exiting the position later.
Traders should generally avoid strikes with zero or minimal open interest unless specific circumstances justify the additional costs and risks.
Using Open Interest To Improve Options Trading Strategies
Integrating open interest analysis into a comprehensive trading approach requires combining this metric with other indicators. Before establishing a position, examine open interest across relevant strikes. Look for concentration at strike prices that align with technical support or resistance levels.
Monitor whether open interest grows or contracts as a trend develops. Rising open interest during an advance confirms participation and conviction. If prices continue climbing but open interest stagnates or declines, question the sustainability of the move.
Declining open interest in positions similar to your own may signal that other traders are closing their exposure, providing early warning to consider taking profits or tightening stops.
Above the Green Line provides comprehensive tools and analysis to help traders leverage these insights effectively. Access detailed option chain data, technical indicators, and strategic frameworks designed to improve trade timing and selection through a membership that delivers actionable market intelligence.

Related Articles
Stock Trade =====>

Margin Call Explained: What Triggers It and How to Avoid One

AMC Short Squeeze Explained: Timeline, Causes, and Trading Risks

Volatility Clustering in Financial Markets: Understand Why It Happens

Chaikin Money Flow (CMF): How to Use Volume to Spot Real Market Strength
